Is this your Brand? Log in to Hoodie!
Log in to HoodieMary's Medicinals
Data Snapshot for Mar 19, 2026
Overview
From our headquarters in Denver, we develop products that maximize the benefits of cannabinoids, terpenes and other plant nutrients. In addition to being the first company to deliver transdermal cannabis products, Marys was first to market THCa and CBN. We also discovered harvest...
MARY'S MEDICINALS faces a 35.9% decline in sales year-over-year—mid-tier positioning. The 26.4% drop over the last three months underscores a challenging market environment as the brand struggles to connect with buyers.
Categories
- Top Category: Topicals
- Price Tier: Mid-Market
- States Active: 12
Top States
Mary's Medicinals Top StatesFeb 2026
Top states where Mary's Medicinals is active based on indexed sales coverage.
Trend View
Market Insights SnapshotFeb 2026
Trend narrative unavailable.
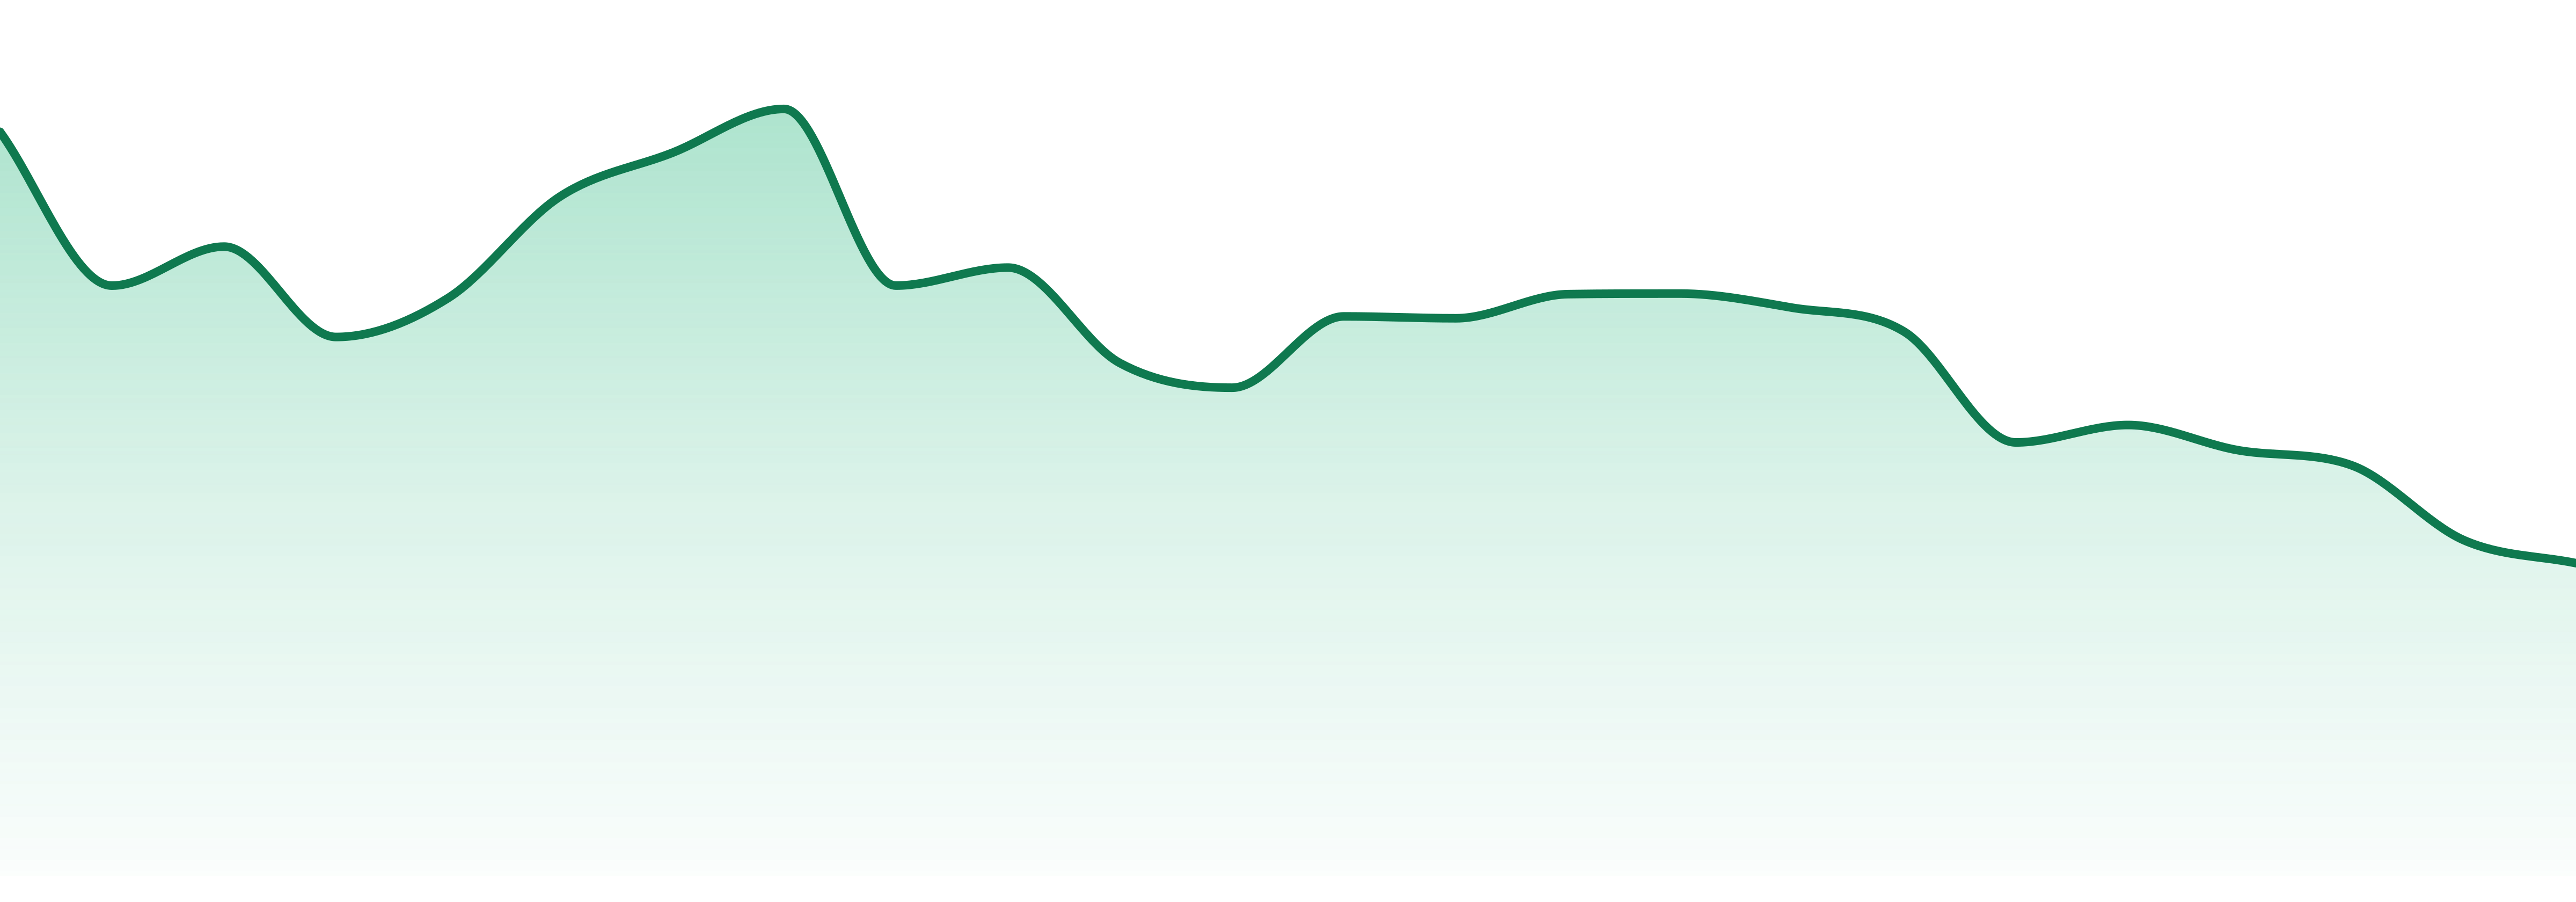
24-Month Trend
Average Price
$24.21
YoY Sales Trend
35.9%
2Y Sales Trend
64.3%
Topicals dominate at 78.6%, but are down 36.7% YoY. Concentrates stand out with a striking 49.9% growth, while Flower and Edibles face severe declines of 65.6% and 52.1% respectively.
| Category | Sales Share | Avg Price | YoY |
|---|---|---|---|
| Topicals | 78.6% | $23.24 | 36.7% |
| Oral | 20.0% | $29.72 | 30.0% |
MARY'S MEDICINALS thrives primarily in California (35.8%) and Michigan (27.6%), with a solid presence in Missouri (22.5%) and Arkansas (8.9%). The brand is active across 12 states, showcasing significant geographic reach.
| State | Oral | Topicals |
|---|---|---|
| 2 | 1 | |
| 3 | 2 | |
| 7 | 1 | |
| 17 | 2 | |
| 13 | 8 |
Want SKU-Level Buyer Signals?
Unlock purchaser contacts, SKU-level velocity, and whitespace opportunities for this brand.
Market Position
Competitive LandscapeFeb 2026
MARY'S MEDICINALS holds the #2 rank in Topicals, trailing PAPA & BARKLEY at #1. Gaining ground on HIGH DESERT PURE at #5 while maintaining a solid position against BUDDIES and LIQUID FLOWER.
SKU View
Notable ProductsFeb 2026
Top products for Feb 2026 with sales and momentum indicators.
| Product | Category | MoM |
|---|---|---|
#1 | Topicals | 14.4% |
#2 | Topicals | 7.6% |
#3 | Topicals | 23.0% |
#4 | Topicals | 21.4% |
#5 | Topicals | 19.7% |
#6 | Topicals | 10.4% |
#7 | Topicals | 19.6% |
#8 | Topicals | 247.6% |
#9 | Oral | 86.1% |
#10 | Oral | 130.4% |
Benchmarking
Competitive Peer Set
Peer brands benchmarked against Mary's Medicinals using competitive landscape rank coverage, proximity, and momentum.


