Is this your Brand? Log in to Hoodie!
Log in to HoodieLiquid Flower
Data Snapshot for Mar 19, 2026
Overview
Liquid Flowers whole plant philosophy uses simplistic, quality organic and natural ingredients that are effective for numerous conditions. We are committed to making a superior product that we feel great about, and one we love to share with our family and friends. We offer whole...
LIQUID FLOWER's sales surged 21.3% over the last three months, showcasing strong momentum as it continues to climb. With a mid-tier pricing strategy, the brand is positioned well for sustained growth.
Categories
- Top Category: Topicals
- Price Tier: Mid-Market
- States Active: 3
Top States
Liquid Flower Top StatesFeb 2026
Top states where Liquid Flower is active based on indexed sales coverage.
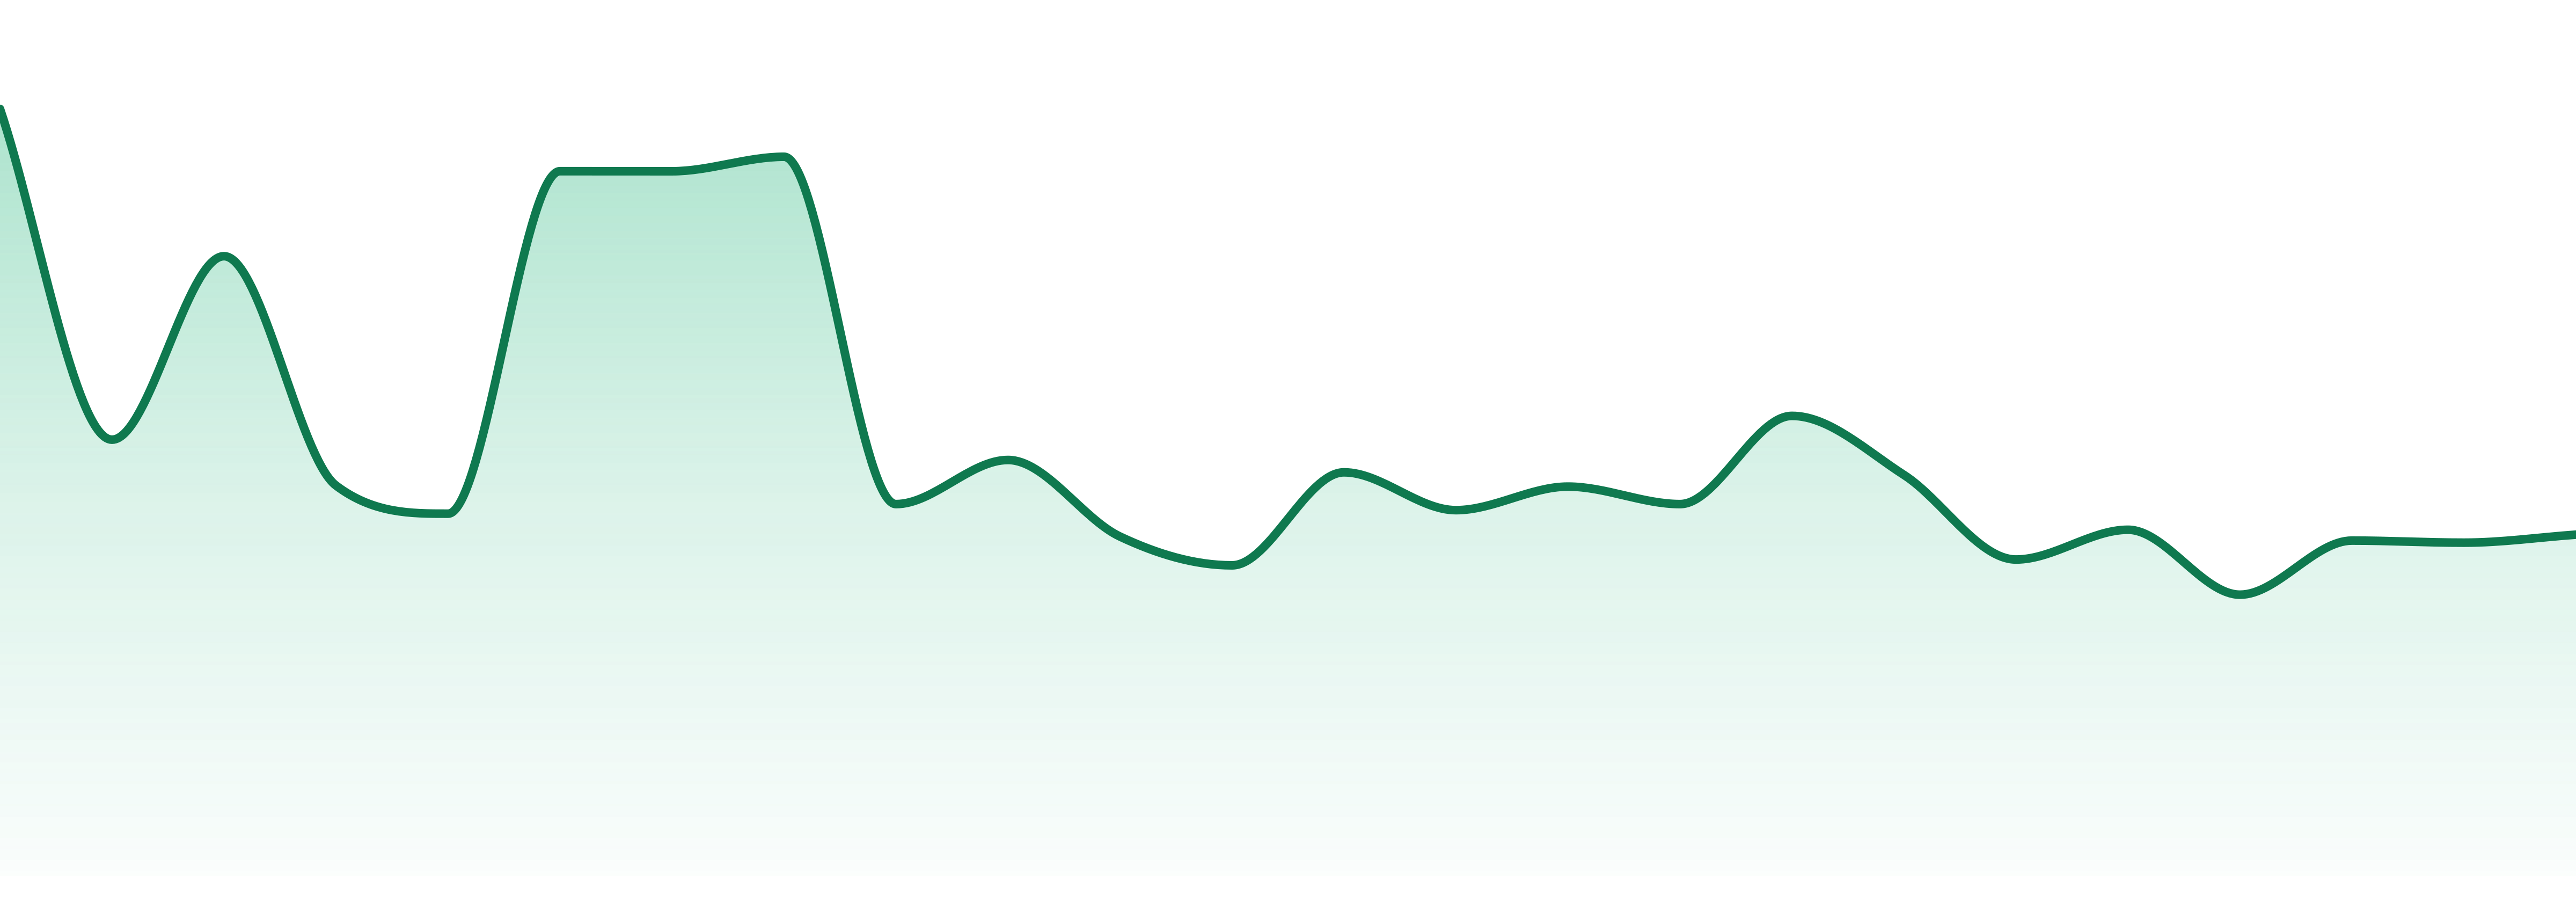
Trend View
Market Insights SnapshotFeb 2026
Trend narrative unavailable.
24-Month Trend
Average Price
$24.22
YoY Sales Trend
9.9%
2Y Sales Trend
66.3%
Topicals dominate at 94.7% of sales, showing a 13.2% YoY increase, while Oral products plummet 53.5% YoY. Fastest-growing category remains Topicals, while Edibles struggle with a staggering 94.7% YoY decline.
| Category | Sales Share | Avg Price | YoY |
|---|---|---|---|
| Topicals | 94.8% | $24.57 | 13.2% |
| Vapes | 2.2% | $29.4 | N/A |
| Oral | 2.2% | $18.73 | 53.5% |
LIQUID FLOWER's strength is concentrated in California (96.9% of sales), with South Dakota (2.2%) and Montana (0.8%) as secondary markets. The geographic footprint is tightly focused across just three states.
| State | Oral | Topicals | Vapes |
|---|---|---|---|
| ⊖ | ⊖ | 16 | |
| ⊖ | 4 | ⊖ |
Want SKU-Level Buyer Signals?
Unlock purchaser contacts, SKU-level velocity, and whitespace opportunities for this brand.
Market Position
Competitive LandscapeFeb 2026
#4 in Topicals, gaining ground against leaders PAPA & BARKLEY (#1) and MARY'S MEDICINALS (#2). The brand is two spots behind MARY'S and just one behind BUDDIES (#3), indicating competitive tension.
SKU View
Notable ProductsFeb 2026
Top products for Feb 2026 with sales and momentum indicators.
| Product | Category | MoM |
|---|---|---|
#1 | Topicals | 9.6% |
#2 | Topicals | 30.4% |
#3 | Topicals | 22.0% |
#4 | Topicals | 4.0% |
#5 | Topicals | 702.8% |
#6 | Topicals | 409.9% |
#7 | Topicals | 122.5% |
#8 | Topicals | 270.4% |
#9 | Topicals | 210.3% |
#10 | Topicals | 166.7% |
Benchmarking
Competitive Peer Set
Peer brands benchmarked against Liquid Flower using competitive landscape rank coverage, proximity, and momentum.


