Is this your Brand? Log in to Hoodie!
Log in to HoodieHigh Desert Pure
Data Snapshot for Mar 19, 2026
Overview
At High Desert Pure, we hold our CO2 concentrate to the highest standard. We strive for quality you can taste, feel, and savor. As part of our purity promise, we share our third party lab test results with you. You can see the terpenes that are in each strain and also that we don...
HIGH DESERT PURE faces a significant 10.3% decline over the last three months, yet year-over-year sales rose by 4.9%. This juxtaposition highlights a potential niche appeal even as overall trends weaken in the premium segment.
Categories
- Top Category: Topicals
- Price Tier: Premium
- States Active: 2
Top States
High Desert Pure Top StatesFeb 2026
Top states where High Desert Pure is active based on indexed sales coverage.
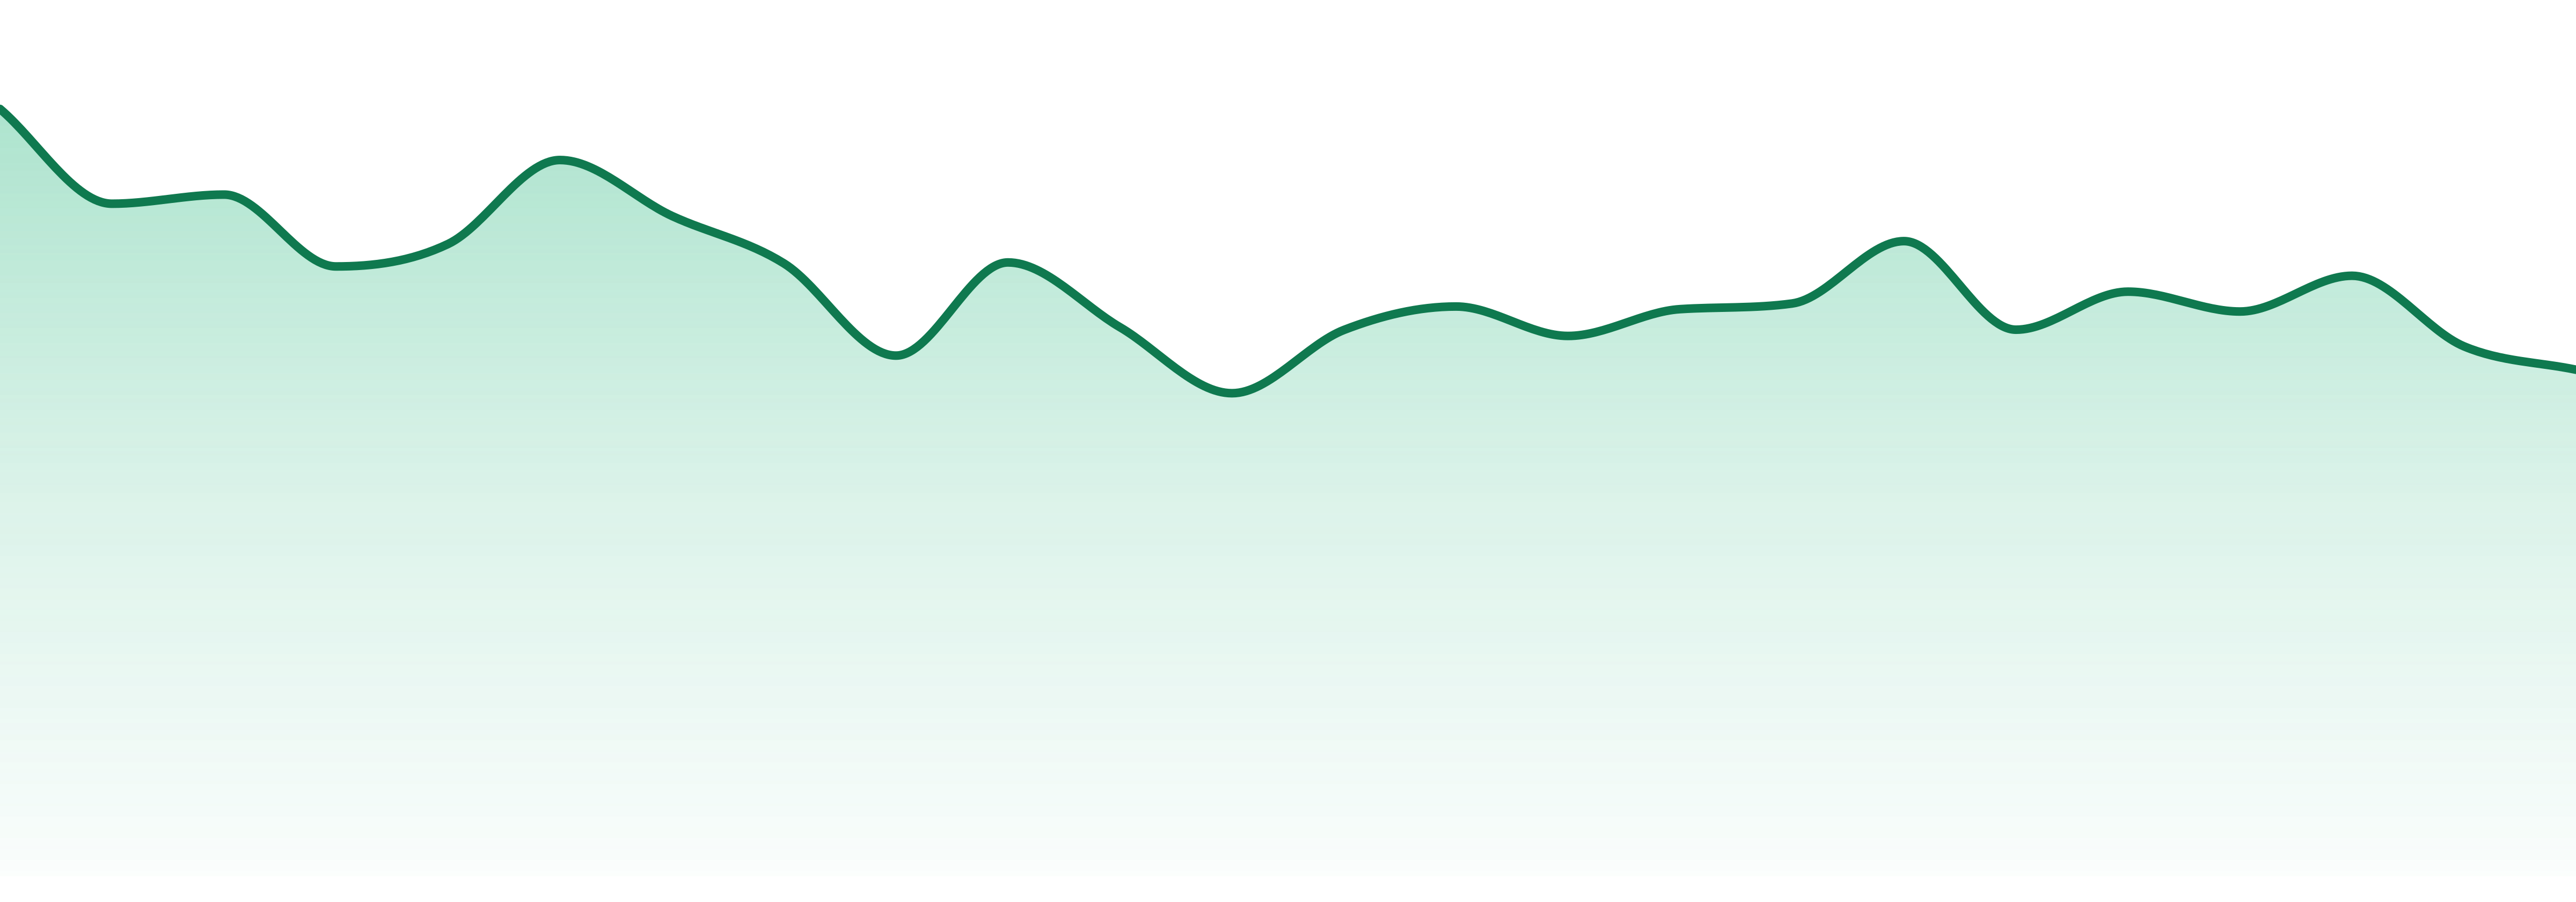
Trend View
Market Insights SnapshotFeb 2026
Trend narrative unavailable.
24-Month Trend
Average Price
$28.37
YoY Sales Trend
4.9%
2Y Sales Trend
38.9%
Topicals dominate with 75.2% of sales, showing a slight YoY increase of 1.9%. Oral products are the fastest-growing at 18.7% YoY, while Other categories struggle, declining by 4.2%.
| Category | Sales Share | Avg Price | YoY |
|---|---|---|---|
| Topicals | 75.4% | $29.85 | 1.9% |
| Oral | 19.3% | $28.8 | 18.7% |
| Edibles | 4.3% | $16.88 | 8.5% |
HIGH DESERT PURE thrives in Oregon and California, with a strong geographic concentration—Oregon commands 89.4% of their sales.
| State | Edibles | Oral | Topicals |
|---|---|---|---|
| 44 | 5 | 1 | |
| ⊖ | 43 | 5 |
Want SKU-Level Buyer Signals?
Unlock purchaser contacts, SKU-level velocity, and whitespace opportunities for this brand.
Market Position
Competitive LandscapeFeb 2026
HIGH DESERT PURE leads in Topicals, ranked #1. It faces competition from MEDICINE FARM BOTANICALS at #2 and BUDDIES at #3, each maintaining strong positions in this category.
SKU View
Notable ProductsFeb 2026
Top products for Feb 2026 with sales and momentum indicators.
| Product | Category | MoM |
|---|---|---|
#1 | Topicals | 20.1% |
#2 | Topicals | 8.5% |
#3 | Topicals | 5.3% |
#4 | Topicals | 14.2% |
#5 | Topicals | 6.0% |
#6 | Topicals | 56.1% |
#7 | Oral | 18.7% |
#8 | Oral | 27.9% |
#9 | Topicals | 102.9% |
#10 | Edibles | 86.8% |
Benchmarking
Competitive Peer Set
Peer brands benchmarked against High Desert Pure using competitive landscape rank coverage, proximity, and momentum.


