Is this your Brand? Log in to Hoodie!
Log in to HoodieGood Green
Data Snapshot for Mar 19, 2026
Overview
Good Green is about a desire to fight back against the War on Drugs and its devastating impact on Black and Brown communities in the U.S. The issue is complex. But how we begin to change ittogetherdoes not have to be. We have the green. You have the power to make a responsible ch...
GOOD GREEN surged +56.4% year-over-year, a standout pace for a premium-tier cannabis brand now seated in the 10-15M sales tier. Three-month momentum of +12.8% confirms the trajectory is accelerating, not coasting.
Categories
- Top Category: Flower
- Price Tier: Premium
- States Active: 16
Top States
Good Green Top StatesFeb 2026
Top states where Good Green is active based on indexed sales coverage.
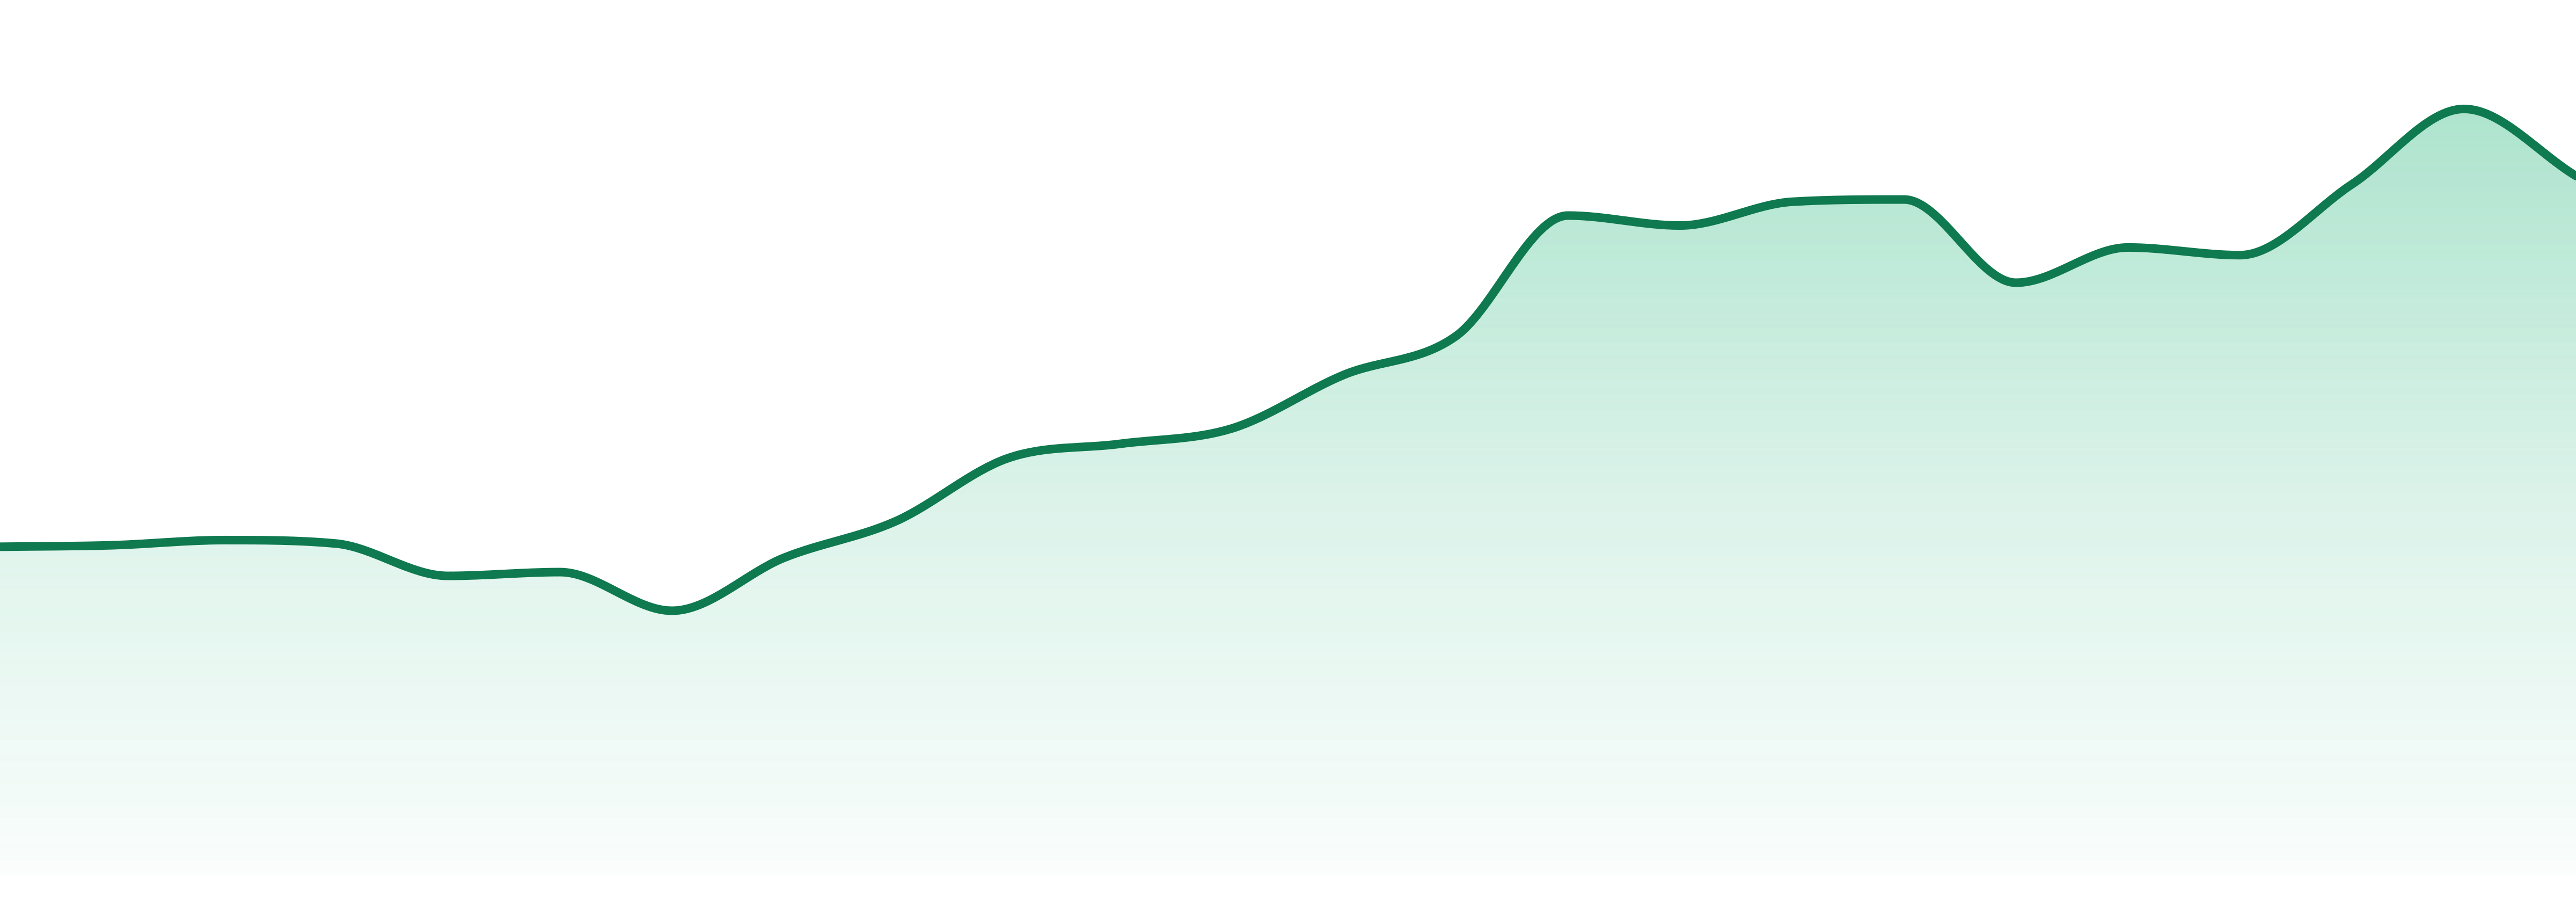
Trend View
Market Insights SnapshotFeb 2026
Trend narrative unavailable.
24-Month Trend
Average Price
$39.19
YoY Sales Trend
56.4%
2Y Sales Trend
139.1%
Pre-Rolls exploded nearly 200x YoY from a tiny base, while Flower still commands 86.3% of sales at +36.0% YoY. Edibles collapsed -95.5%, effectively exiting the mix. GOOD GREEN remains a Flower-first brand with nascent diversification.
| Category | Sales Share | Avg Price | YoY |
|---|---|---|---|
| Flower | 87.2% | $39.03 | 36.0% |
| Vapes | 12.0% | $55.4 | N/A |
GOOD GREEN operates across 16 states, concentrated in the mid-Atlantic and Midwest. Pennsylvania leads at 25.6%, followed by Illinois at 20.7% and New Jersey at 11.3%—three top cannabis brand markets driving over half of total volume.
| State | Flower | Vapes |
|---|---|---|
| 2 | 11 | |
| 6 | 12 | |
| 5 | 27 | |
| 8 | 26 | |
| 16 | 27 |
Want SKU-Level Buyer Signals?
Unlock purchaser contacts, SKU-level velocity, and whitespace opportunities for this brand.
Market Position
Competitive LandscapeFeb 2026
#6 in Flower, holding steady from a year ago despite gaining one position over HIGH SUPPLY, GRASSROOTS CANNABIS, and MODERN FLOWER individually. RYTHM holds the #1 spot, five ranks ahead. ORGANIC REMEDIES at #5 is the nearest target.
SKU View
Notable ProductsFeb 2026
Top products for Feb 2026 with sales and momentum indicators.
| Product | Category | MoM |
|---|---|---|
#1 | Flower | 7.9% |
#2 | Flower | 31.7% |
#3 | Flower | 20.2% |
#4 | Flower | 22.0% |
#5 | Flower | 11.4% |
#6 | Flower | 154.4% |
#7 | Flower | 401.6% |
#8 | Other | 264.9% |
#9 | Flower | 134.2% |
#10 | Flower | 621.8% |
Benchmarking
Competitive Peer Set
Peer brands benchmarked against Good Green using competitive landscape rank coverage, proximity, and momentum.


