Is this your Brand? Log in to Hoodie!
Log in to HoodieBreez
Data Snapshot for Mar 19, 2026
Overview
Breez Health helps hospitals provide patients with an easy-to-use, online option to see if they qualify for assistance and navigate their financial options. We understand the complexities of financial assistance programs that exist today and are dedicated to designing better proc...
BREEZ faces a steep decline with YoY growth at -11.1%—slipping from #2 to #4 in California. Over the last three months, sales trend down 10.3%, indicating competitive pressure in the premium tier.
Categories
- Top Category: Oral
- Price Tier: Premium
- States Active: 5
Top States
Breez Top StatesFeb 2026
Top states where Breez is active based on indexed sales coverage.
Trend View
Market Insights SnapshotFeb 2026
Trend narrative unavailable.
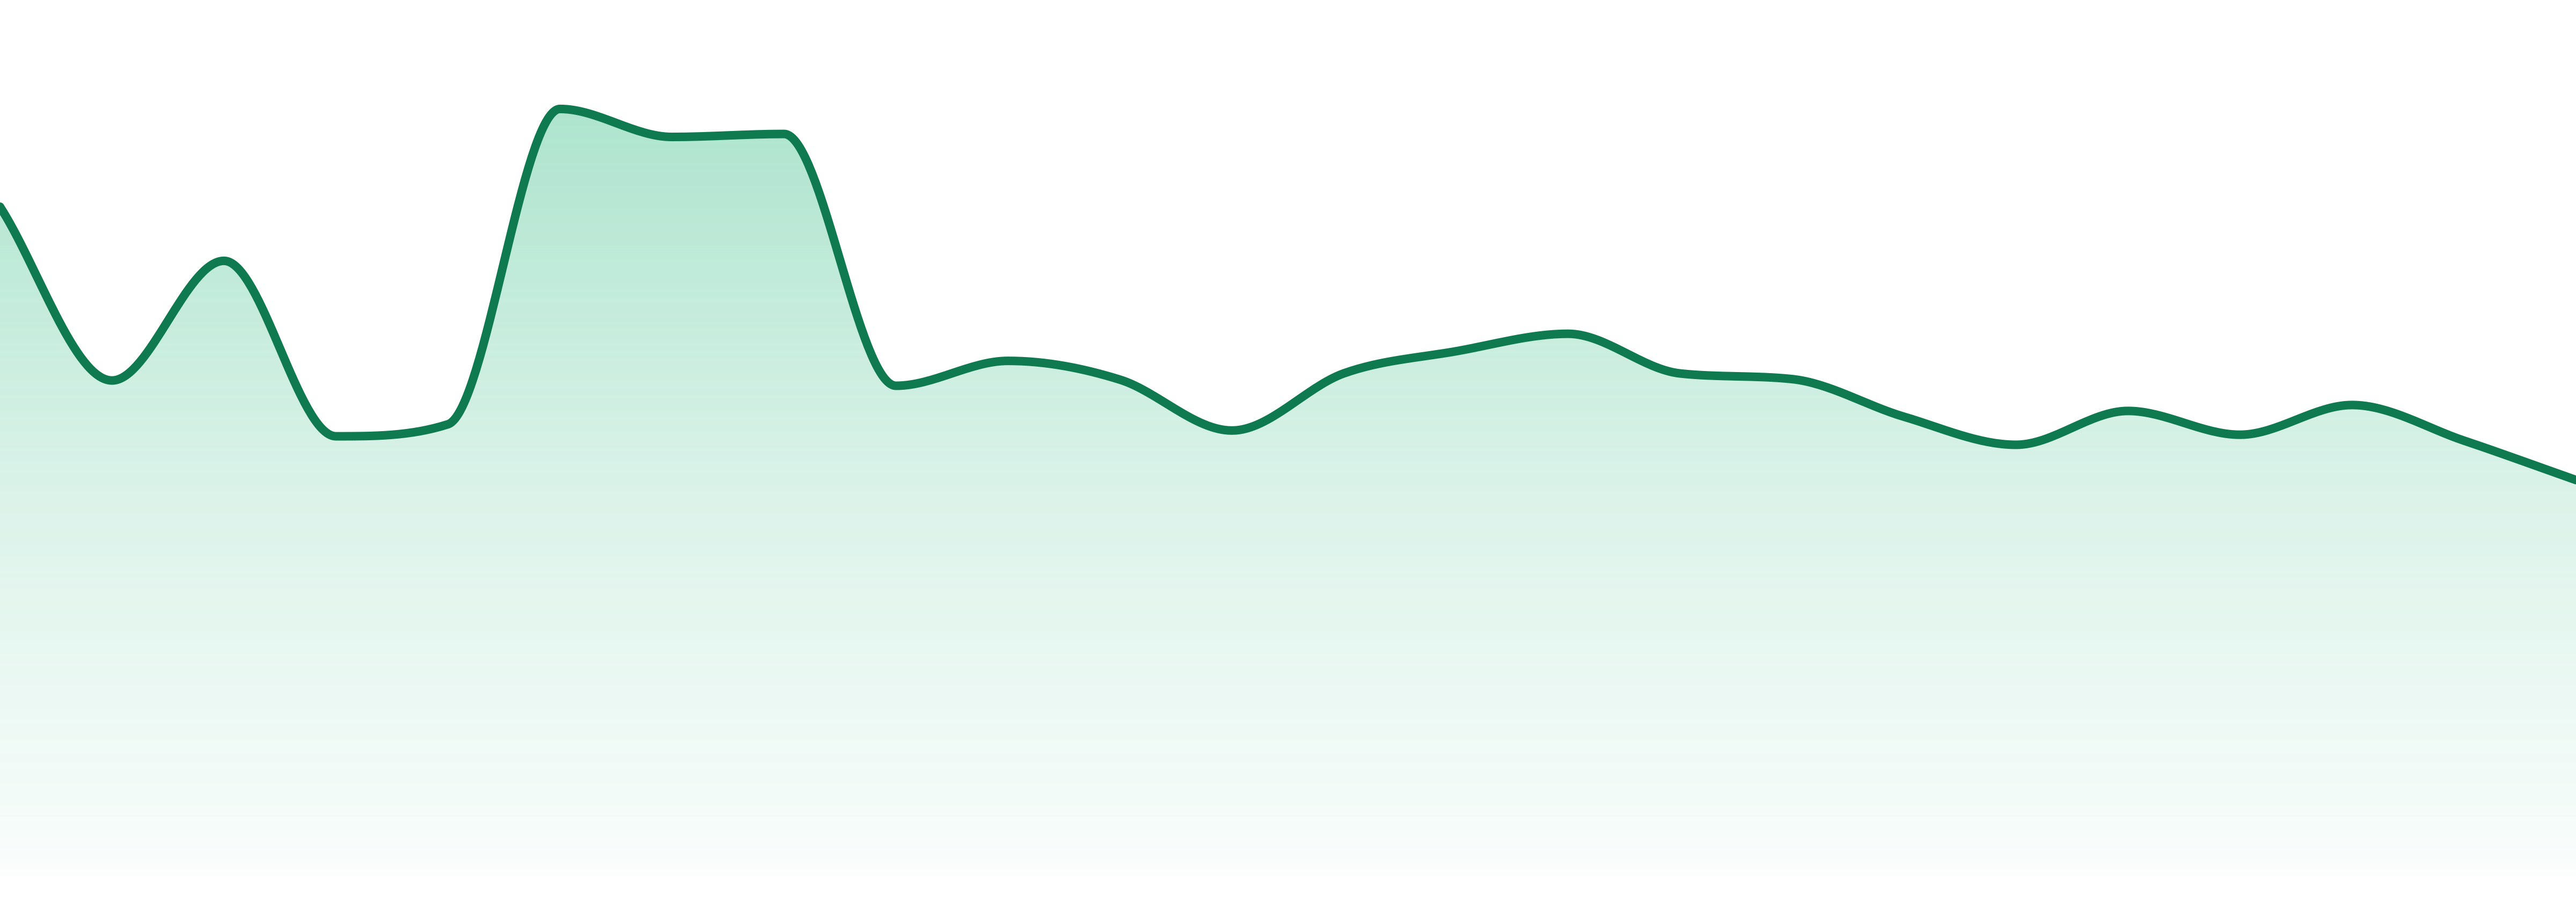
24-Month Trend
Average Price
$26.49
YoY Sales Trend
11.1%
2Y Sales Trend
60.7%
Oral leads with 72.6% of sales but is down 5.5% YoY. Edibles and Vapes see significant declines, with Vapes plummeting 52.7%. The Other category skyrockets, showing an astonishing 9656.6% growth YoY.
| Category | Sales Share | Avg Price | YoY |
|---|---|---|---|
| Oral | 72.8% | $36.5 | 5.5% |
| Edibles | 20.3% | $12.86 | 25.0% |
| Concentrates | 5.2% | $53.5 | 6.0% |
California dominates BREEZ's footprint at 85.5% of sales, followed by Illinois at 11.9%. With a total of 5 active states, geographic concentration is high.
| State | Concentrates | Edibles | Oral |
|---|---|---|---|
| ⊖ | ⊖ | 1 | |
| ⊖ | ⊖ | 3 | |
| ⊖ | 42 | 4 | |
| ⊖ | ⊖ | ⊖ |
Want SKU-Level Buyer Signals?
Unlock purchaser contacts, SKU-level velocity, and whitespace opportunities for this brand.
Market Position
Competitive LandscapeFeb 2026
Competitive summary unavailable.
SKU View
Notable ProductsFeb 2026
Top products for Feb 2026 with sales and momentum indicators.
| Product | Category | MoM |
|---|---|---|
#1 | Oral | 21.3% |
#2 | Edibles | 0.5% |
#3 | Oral | 121.4% |
#4 | Oral | 13.6% |
#5 | Oral | 2.7% |
#6 | Oral | 46.0% |
#7 | Edibles | 22.6% |
#8 | Edibles | 12.9% |
#9 | Oral | 742.1% |
#10 | Edibles | 123.0% |
Benchmarking
Competitive Peer Set
Peer brands benchmarked against Breez using competitive landscape rank coverage, proximity, and momentum.


