Is this your Brand? Log in to Hoodie!
Log in to HoodieVital
Data Snapshot for Mar 19, 2026
Overview
Vital edibles were first crafted in 2011 to bring delicious, fruit-forward flavors and, most importantly enriched experiences to Arizonians. Over the past decade, recipes and options have been refined based on customer feedback. Vital's nanotechnology was perfected to bring rapi...
VITAL's sales have dropped 24.6% YoY—trending down 16.2% over the last three months. Positioned in the low tier, this decline highlights significant challenges in maintaining market share.
Categories
- Top Category: Edibles
- Price Tier: Value
- States Active: 3
Top States
Vital Top StatesFeb 2026
Top states where Vital is active based on indexed sales coverage.
Trend View
Market Insights SnapshotFeb 2026
Trend narrative unavailable.
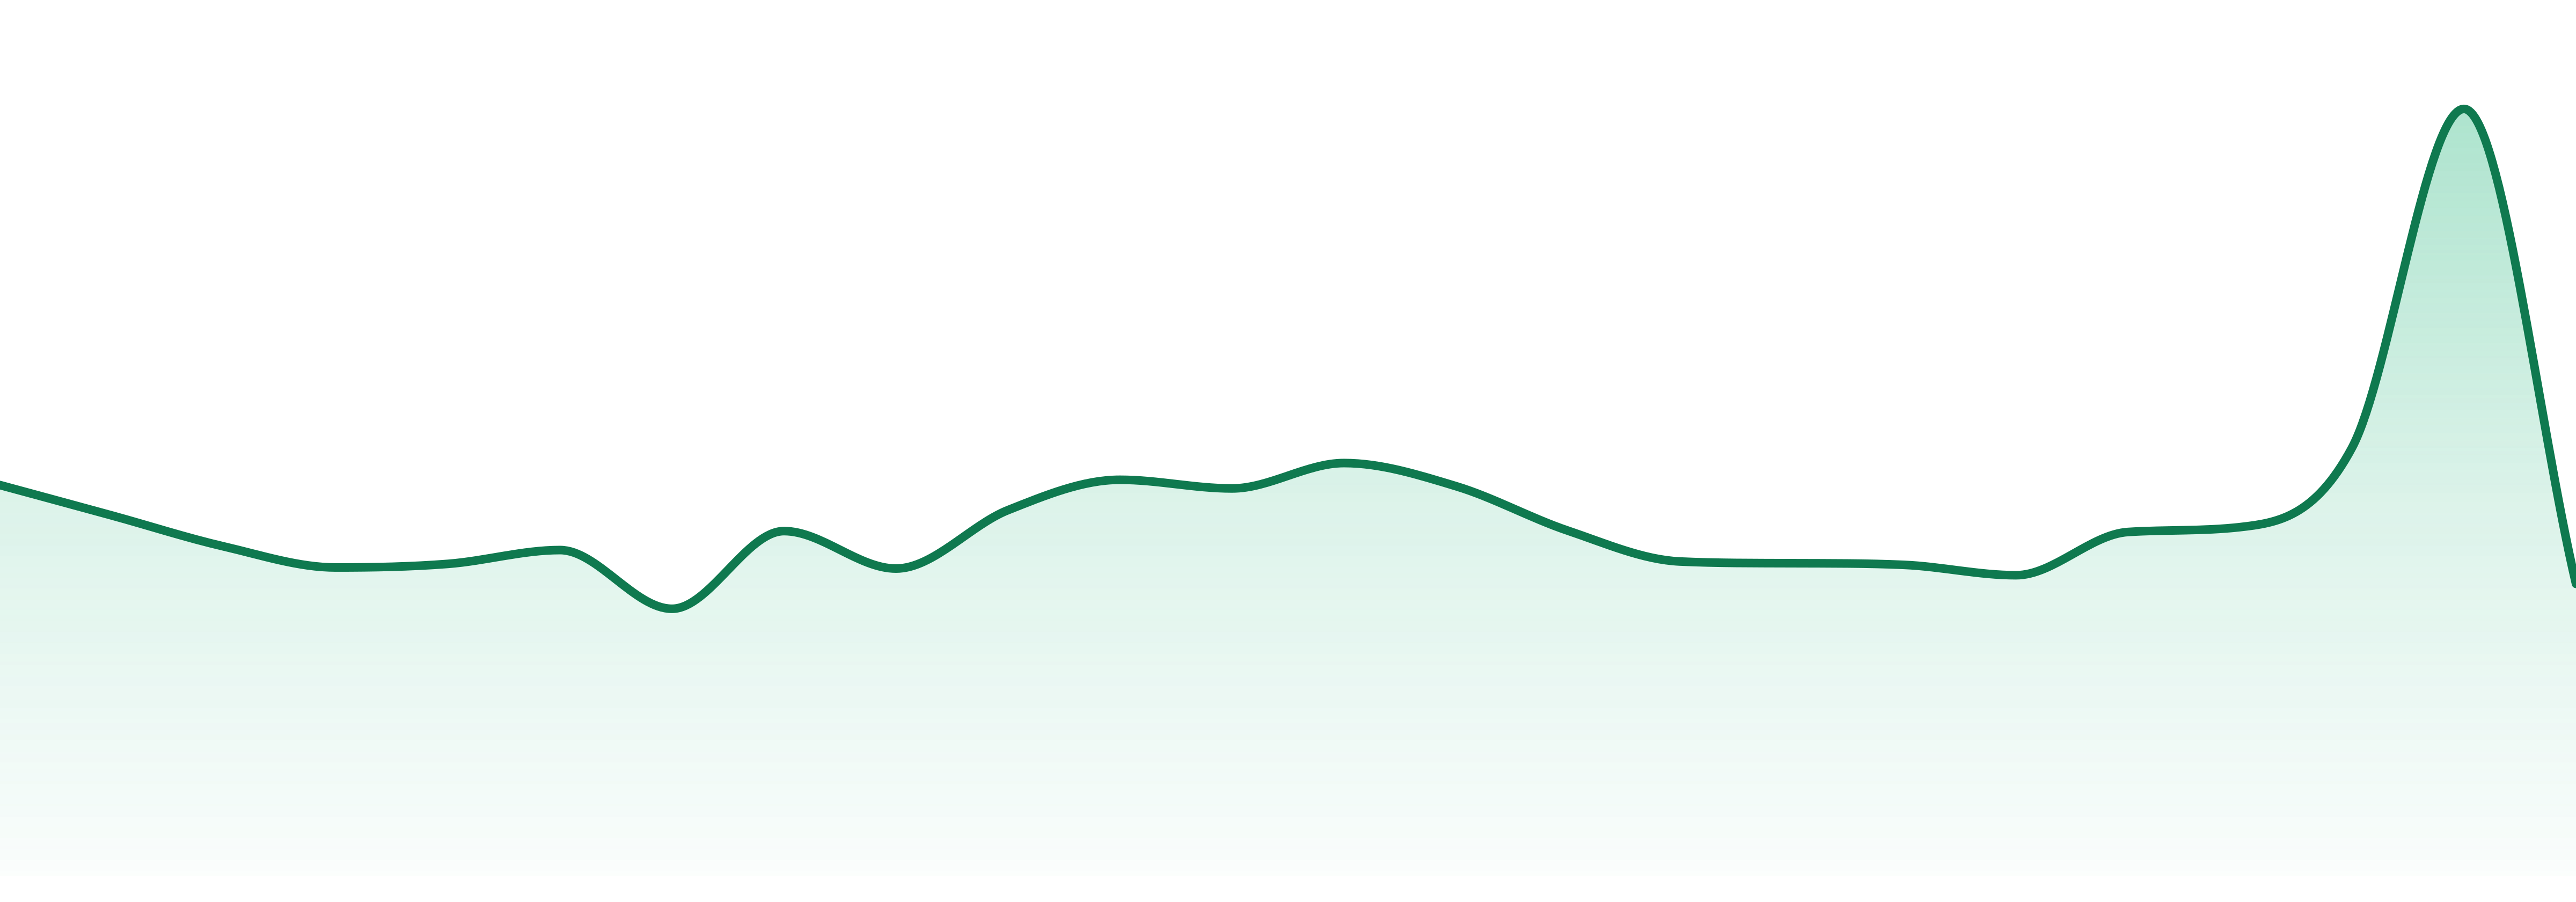
24-Month Trend
Average Price
$8.86
YoY Sales Trend
24.6%
2Y Sales Trend
23.9%
Edibles dominate at 93.9%, yet have seen a YoY decline of 27.3%. Oral and Flower categories contribute minimally, reflecting a concentrated market with slow growth.
| Category | Sales Share | Avg Price | YoY |
|---|---|---|---|
| Edibles | 93.9% | $8.54 | 27.3% |
| Oral | 3.3% | $14.73 | 3.2% |
| Flower | 2.8% | $41.85 | N/A |
VITAL's strongest presence is in Arizona, which accounts for 97.2% of sales, with limited reach into Alaska and Ontario. This indicates a highly concentrated geographic footprint.
Want SKU-Level Buyer Signals?
Unlock purchaser contacts, SKU-level velocity, and whitespace opportunities for this brand.
Market Position
Competitive LandscapeFeb 2026
Competitive summary unavailable.
SKU View
Notable ProductsFeb 2026
Top products for Feb 2026 with sales and momentum indicators.
| Product | Category | MoM |
|---|---|---|
#1 | Edibles | 71.5% |
#2 | Edibles | 76.1% |
#3 | Edibles | 0.3% |
#4 | Edibles | 60.1% |
#5 | Edibles | 12.6% |
#6 | Edibles | 1.2% |
#7 | Edibles | 12.5% |
#8 | Oral | 8.8% |
#9 | Edibles | 5.6% |
#10 | Flower | 12.9% |
Benchmarking
Competitive Peer Set
Peer brands benchmarked against Vital using competitive landscape rank coverage, proximity, and momentum.


