Is this your Brand? Log in to Hoodie!
Log in to HoodieJourneyman
Data Snapshot for Mar 19, 2026
Overview
Wherever weed grows Journeyman goes, in search of The Good Stuff real fruit and reefer for high quality, all-natural edibles. We take our treats seriously. Vegan & gluten-free, Journeyman Jellies are made with real fruit, inside and out, and all-natural ingredients. Ratios of THC...
JOURNEYMAN's sales soared 50.5% year-over-year, marking a significant leap in market presence. Despite a 6% decline in the last three months, the brand's low-tier pricing strategy is attracting attention in a competitive landscape.
Categories
- Top Category: Edibles
- Price Tier: Value
- States Active: 7
Top States
Journeyman Top StatesFeb 2026
Top states where Journeyman is active based on indexed sales coverage.
Trend View
Market Insights SnapshotFeb 2026
Trend narrative unavailable.
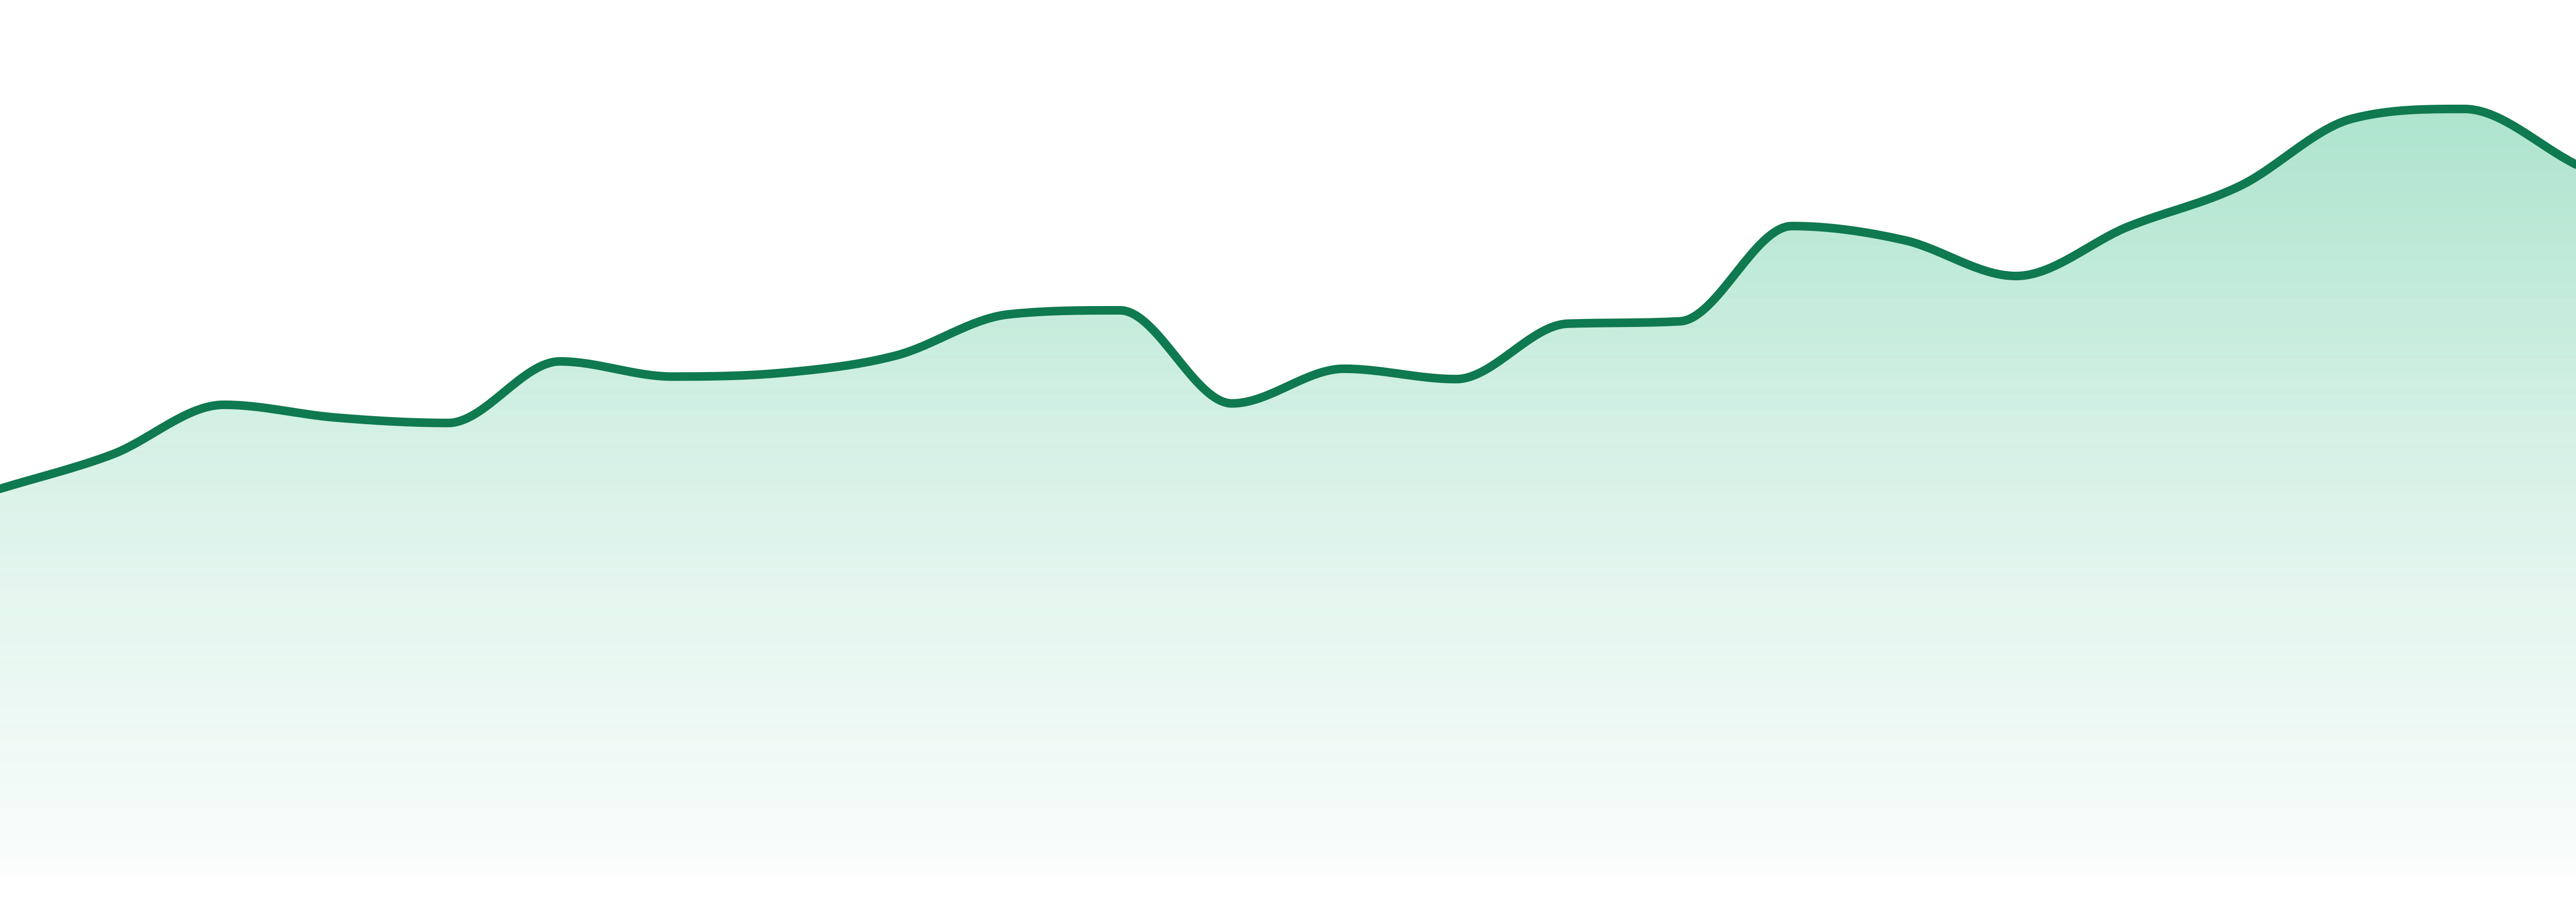
24-Month Trend
Average Price
$10.65
YoY Sales Trend
50.5%
2Y Sales Trend
99.9%
Edibles dominate with 99.5% of sales, showing a 51.1% YoY increase. The 'Other' category is the fastest-growing at +232.2% YoY, while both Oral and Flower categories are facing steep declines.
| Category | Sales Share | Avg Price | YoY |
|---|---|---|---|
| Edibles | 99.8% | $10.64 | 51.1% |
JOURNEYMAN thrives primarily in Washington (59%), followed by Illinois (16.7%) and Colorado (12.7%). The brand's footprint spans 7 states, highlighting significant regional concentration.
| State | Edibles |
|---|---|
| 2 | |
| 13 | |
| 17 | |
| 18 | |
| ⊖ |
Want SKU-Level Buyer Signals?
Unlock purchaser contacts, SKU-level velocity, and whitespace opportunities for this brand.
Market Position
Competitive LandscapeFeb 2026
JOURNEYMAN ranks #2 in the Edibles category, gaining ground on WYLD, the current leader. This upward shift from #3 to #2 reflects strategic positioning in a competitive market.
SKU View
Notable ProductsFeb 2026
Top products for Feb 2026 with sales and momentum indicators.
| Product | Category | MoM |
|---|---|---|
#1 | Edibles | 3.6% |
#2 | Edibles | 2.9% |
#3 | Edibles | 0.4% |
#4 | Edibles | 8.5% |
#5 | Edibles | 14.6% |
#6 | Edibles | 3.2% |
#7 | Edibles | 6.4% |
#8 | Edibles | 11.7% |
#9 | Edibles | 53.8% |
#10 | Edibles | 43.0% |
Benchmarking
Competitive Peer Set
Peer brands benchmarked against Journeyman using competitive landscape rank coverage, proximity, and momentum.


