Is this your Brand? Log in to Hoodie!
Log in to HoodieUncommon Kind
Data Snapshot for Mar 19, 2026
Overview
Pack your bags, set a compass bearing, and chart a course for adventure with Uncommon Kind Cannabis chews. We challenge your taste buds to embark on a global flavor odyssey venturing beyond the ordinary. Just like heading into the unknown, you get to blaze your own trail. Will yo...
UNCOMMON KIND's sales plummeted 76.5% year-over-year, with a 12.8% decline over the last three months. This steep drop coincides with a rank slip from #6 to #8 in Virginia, highlighting the brand's challenges amid market shifts.
Categories
- Top Category: Edibles
- Price Tier: Mid-Market
- States Active: 2
Top States
Uncommon Kind Top StatesFeb 2026
Top states where Uncommon Kind is active based on indexed sales coverage.
Trend View
Market Insights SnapshotFeb 2026
Trend narrative unavailable.
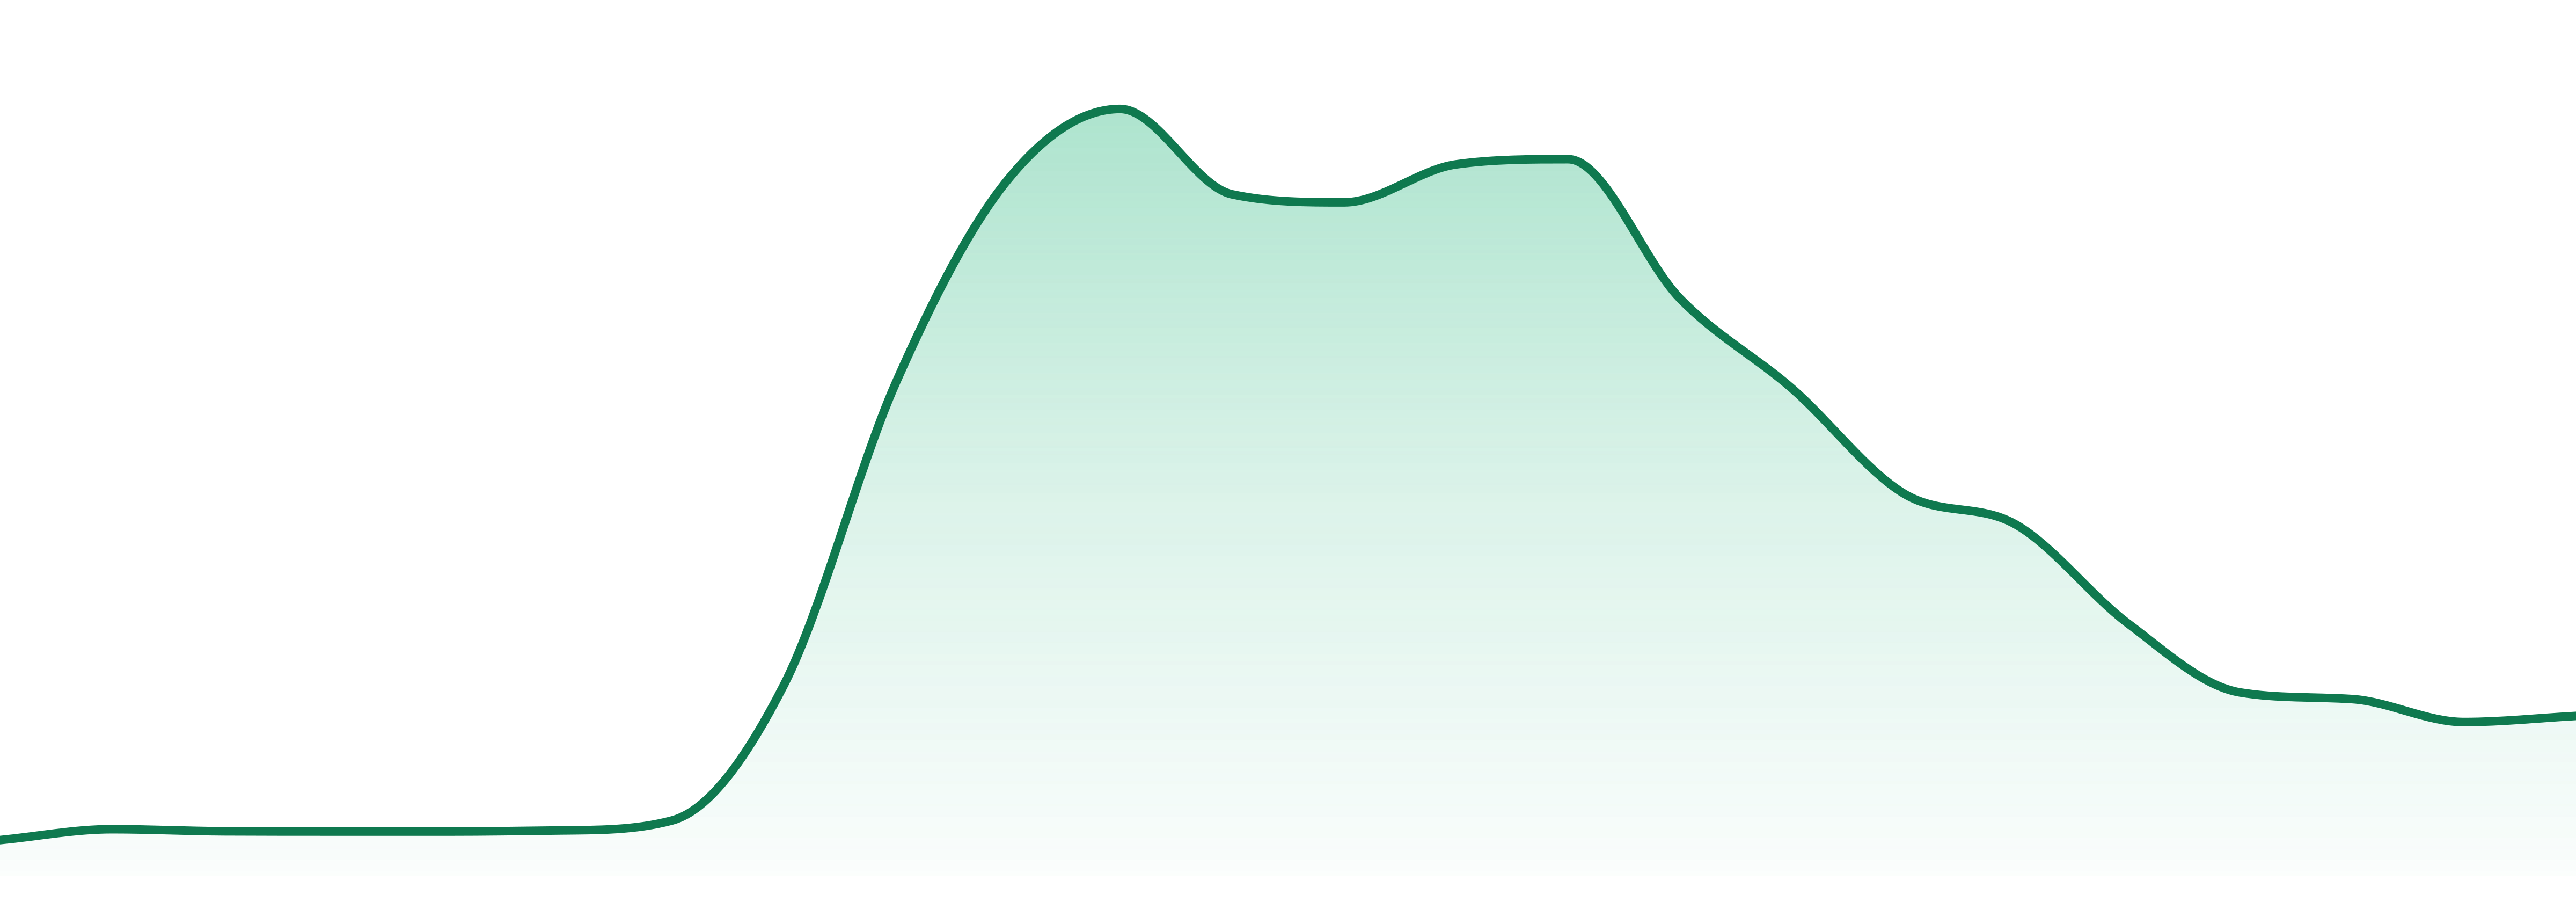
24-Month Trend
Average Price
$20.22
YoY Sales Trend
76.5%
2Y Sales Trend
461.1%
Edibles dominate at 100% of sales but saw a significant drop of 76.5% YoY, marking the slowest growth in the category. This concentration in one category raises concerns about market resilience.
| Category | Sales Share | Avg Price | YoY |
|---|---|---|---|
| Edibles | 100.0% | $20.22 | 76.5% |
UNCOMMON KIND's strongest presence is in Virginia, capturing 94.8% of sales, with Pennsylvania contributing 5.2%. The brand operates in only 2 states, indicating a highly concentrated geographic footprint.
| State | Edibles |
|---|---|
| 8 | |
| 28 |
Want SKU-Level Buyer Signals?
Unlock purchaser contacts, SKU-level velocity, and whitespace opportunities for this brand.
Market Position
Competitive LandscapeFeb 2026
Ranked #8 among peers in the dominant Edibles category, UNCOMMON KIND is trailing behind leaders like ENCORE EDIBLES and HEDY. The brand's rank declined from #6 to #8 over the past year, intensifying competitive pressure.
SKU View
Notable ProductsFeb 2026
Top products for Feb 2026 with sales and momentum indicators.
| Product | Category | MoM |
|---|---|---|
#1 | Edibles | 283.3% |
#2 | Edibles | 15.0% |
#3 | Edibles | 17.8% |
#4 | Edibles | N/A |
#5 | Edibles | N/A |
#6 | Edibles | 69.1% |
Benchmarking
Competitive Peer Set
Peer brands benchmarked against Uncommon Kind using competitive landscape rank coverage, proximity, and momentum.


