Is this your Brand? Log in to Hoodie!
Log in to HoodieRx Pharma
Data Snapshot for Mar 19, 2026
Overview
RX PHARMA's YoY growth hit an impressive 53.4%, despite a 17.5% dip over the last three months. Positioned in the premium tier, this brand is redefining revenue dynamics within the <250K sales bucket.
Categories
- Top Category: Oral
- Price Tier: Premium
- States Active: 1
Top States
Rx Pharma Top StatesFeb 2026
Top states where Rx Pharma is active based on indexed sales coverage.
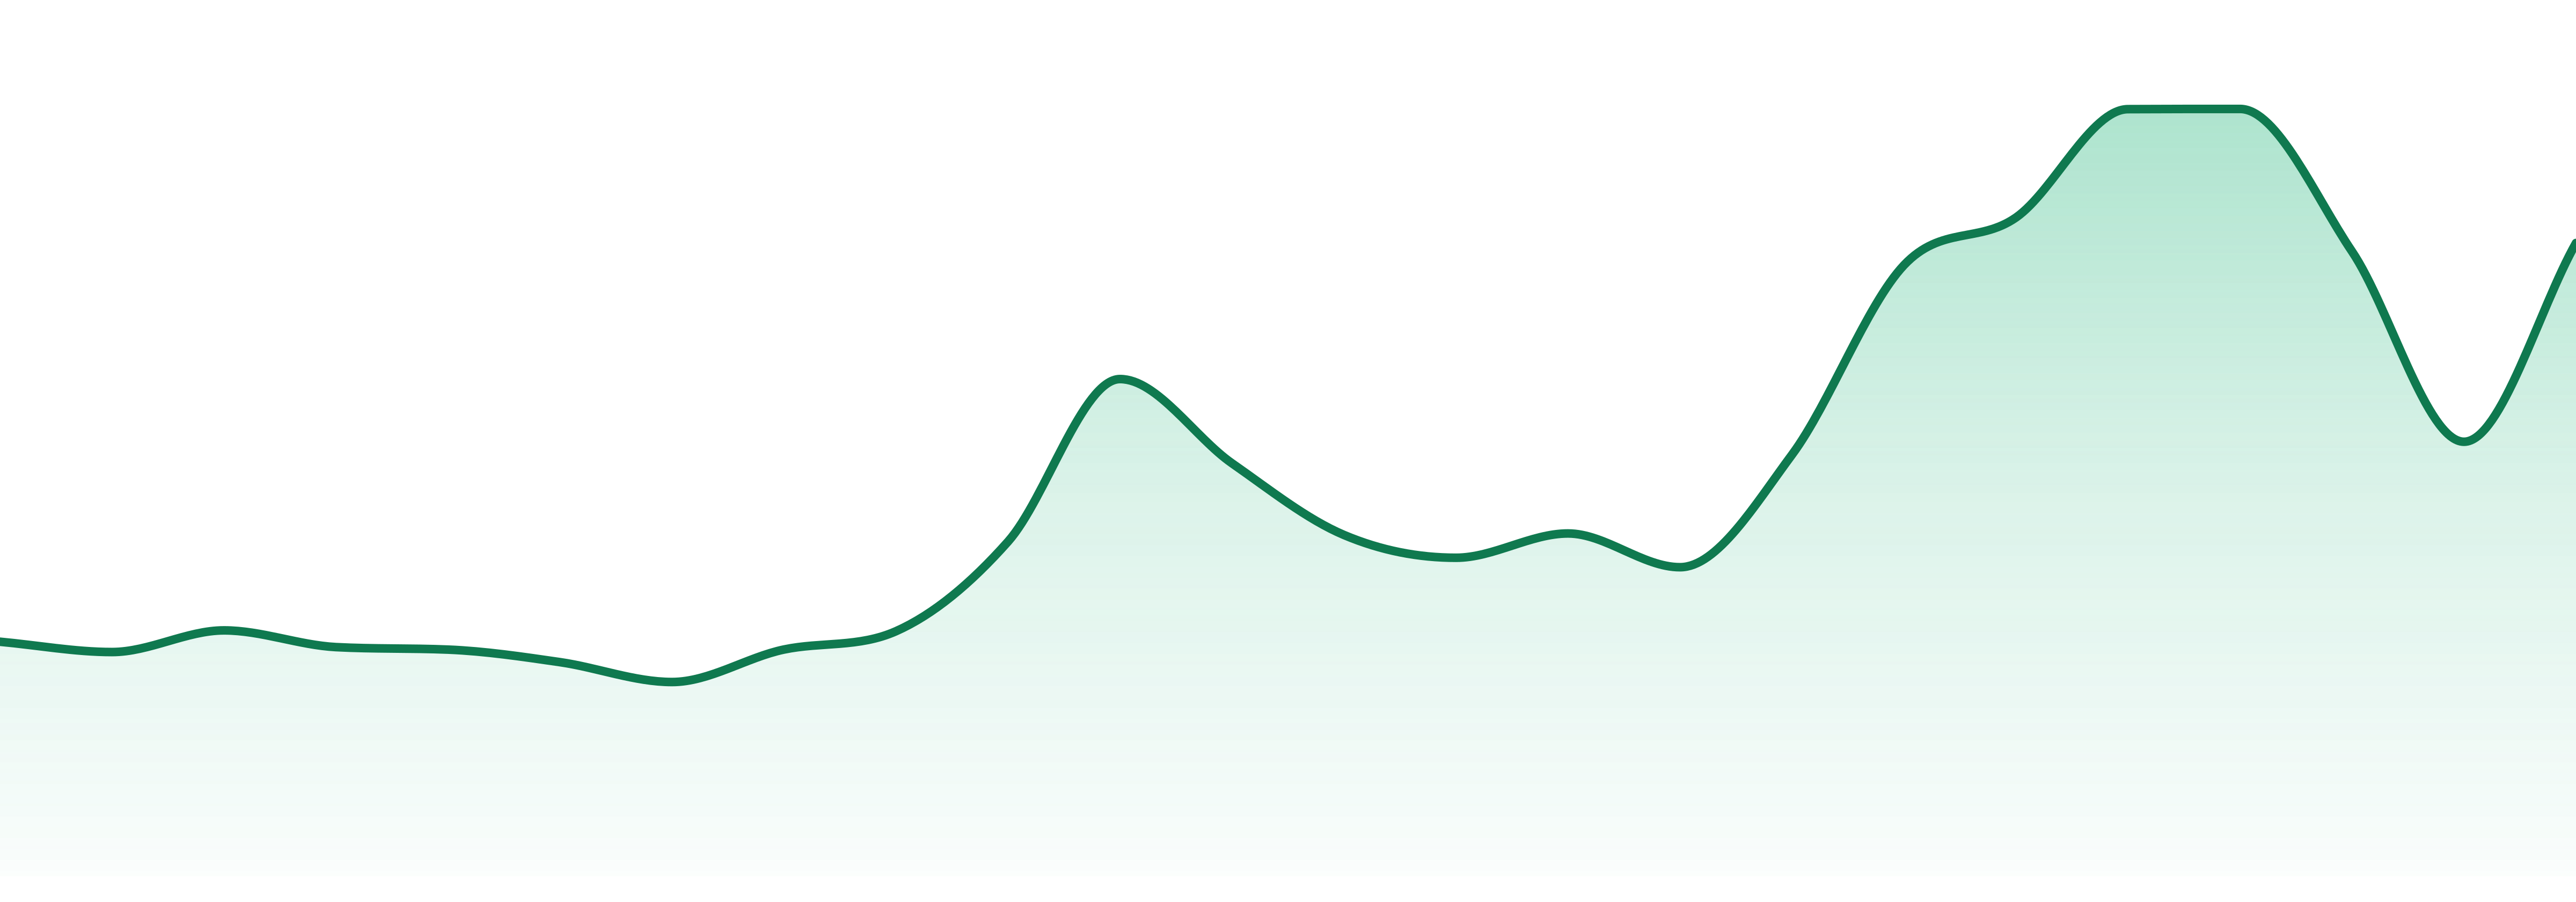
Trend View
Market Insights SnapshotFeb 2026
Trend narrative unavailable.
24-Month Trend
Average Price
$34.76
YoY Sales Trend
53.4%
2Y Sales Trend
166.7%
Oral products dominate at 88.3%, with a solid YoY increase of 35.9%. Meanwhile, Topicals are experiencing explosive growth at 5033.8% YoY, the fastest in the category.
| Category | Sales Share | Avg Price | YoY |
|---|---|---|---|
| Oral | 88.3% | $35.22 | 35.9% |
| Topicals | 11.7% | $31.64 | 5033.8% |
RX PHARMA's market presence is exclusively in West Virginia, capturing 100% of its sales in this state. Geographic concentration is high, showcasing a focused strategy.
| State | Oral | Topicals |
|---|---|---|
| 1 | 2 |
Want SKU-Level Buyer Signals?
Unlock purchaser contacts, SKU-level velocity, and whitespace opportunities for this brand.
Market Position
Competitive LandscapeFeb 2026
RX PHARMA ranks #1 in the Oral category, improving from #2 within a year. Competing closely with MOMENTA and ALTSOL, it leads in West Virginia while others follow.
SKU View
Notable ProductsFeb 2026
Top products for Feb 2026 with sales and momentum indicators.
| Product | Category | MoM |
|---|---|---|
#1 | Topicals | 49.1% |
#2 | Topicals | 98.2% |
#3 | Topicals | 581.3% |
#4 | Topicals | 240.3% |
#5 | Topicals | 107.3% |
Benchmarking
Competitive Peer Set
Peer brands benchmarked against Rx Pharma using competitive landscape rank coverage, proximity, and momentum.


