Is this your Brand? Log in to Hoodie!
Log in to HoodieMonjour
Data Snapshot for Mar 19, 2026
Overview
YoY growth for MONJOUR dropped 17.4%, causing a slip from #9 to #10 in Ontario. Over the last three months, sales fell 8.4%, suggesting a challenging market landscape for this mid-tier brand.
Categories
- Top Category: Edibles
- Price Tier: Mid-Market
- States Active: 8
Top States
Monjour Top StatesFeb 2026
Top states where Monjour is active based on indexed sales coverage.
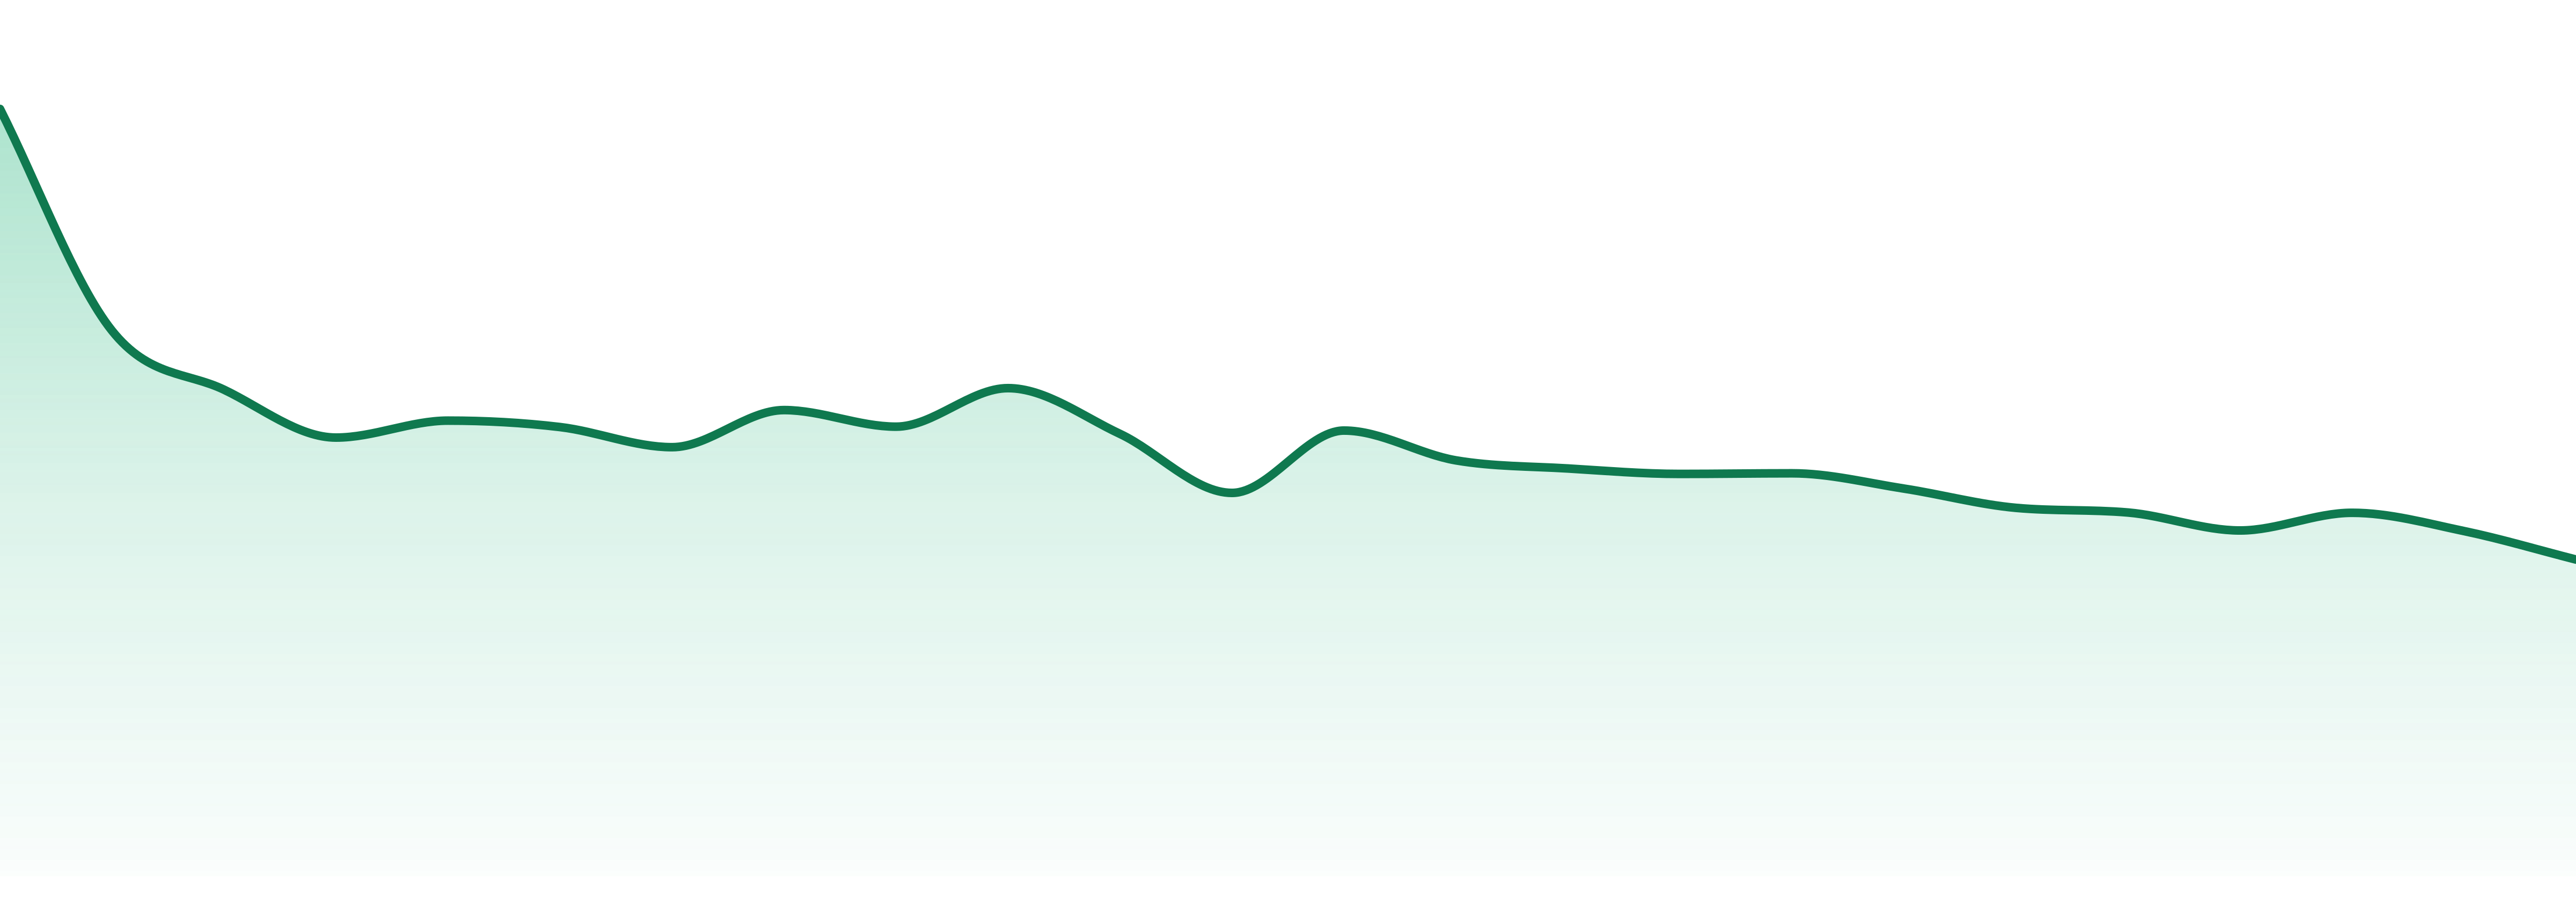
Trend View
Market Insights SnapshotFeb 2026
Trend narrative unavailable.
24-Month Trend
Average Price
$12.85
YoY Sales Trend
17.4%
2Y Sales Trend
60.2%
Edibles dominate at 99.8% but are down 17.5% YoY. In contrast, CBD surged by 435.4% YoY, the fastest-growing category, indicating a shift in consumer preferences.
| Category | Sales Share | Avg Price | YoY |
|---|---|---|---|
| Edibles | 99.8% | $12.84 | 17.5% |
MONJOUR's strongest presence is in Ontario (42.9%), followed by British Columbia (29.2%) and Alberta (18.8%). The brand is active across 8 states, showcasing regional concentration.
Want SKU-Level Buyer Signals?
Unlock purchaser contacts, SKU-level velocity, and whitespace opportunities for this brand.
Market Position
Competitive LandscapeFeb 2026
Competitive summary unavailable.
SKU View
Notable ProductsFeb 2026
Top products for Feb 2026 with sales and momentum indicators.
| Product | Category | MoM |
|---|---|---|
#1 | Edibles | N/A |
#2 | Edibles | 15.2% |
#3 | Edibles | 9.6% |
#4 | Edibles | 3.0% |
#5 | Edibles | 6.8% |
#6 | Edibles | 7.2% |
#7 | Edibles | 12.5% |
#8 | Edibles | 24.9% |
#9 | Edibles | 13.6% |
#10 | Edibles | 31.2% |
Benchmarking
Competitive Peer Set
Peer brands benchmarked against Monjour using competitive landscape rank coverage, proximity, and momentum.


