Is this your Brand? Log in to Hoodie!
Log in to HoodieAvexia
Data Snapshot for Mar 19, 2026
Overview
This medicinal cannabis is formulated from the finest, sustainably sourced U.S. ingredients. We rely heavily on organic ingredients, examining and testing each batch to meet our rigorous standards and guarantee incomparable quality. The Avexia Tetrahydrocannabinol (THC) micro-dos...
AVEXIA's sales dropped 10.5% over the last three months, reflecting a pivot in the premium tier as consumer preferences shift. Year-over-year, the brand is down 9.0%. This trend signals a need for strategic adjustments to regain momentum.
Categories
- Top Category: Topicals
- Price Tier: Premium
- States Active: 11
Top States
Avexia Top StatesFeb 2026
Top states where Avexia is active based on indexed sales coverage.
Trend View
Market Insights SnapshotFeb 2026
Trend narrative unavailable.
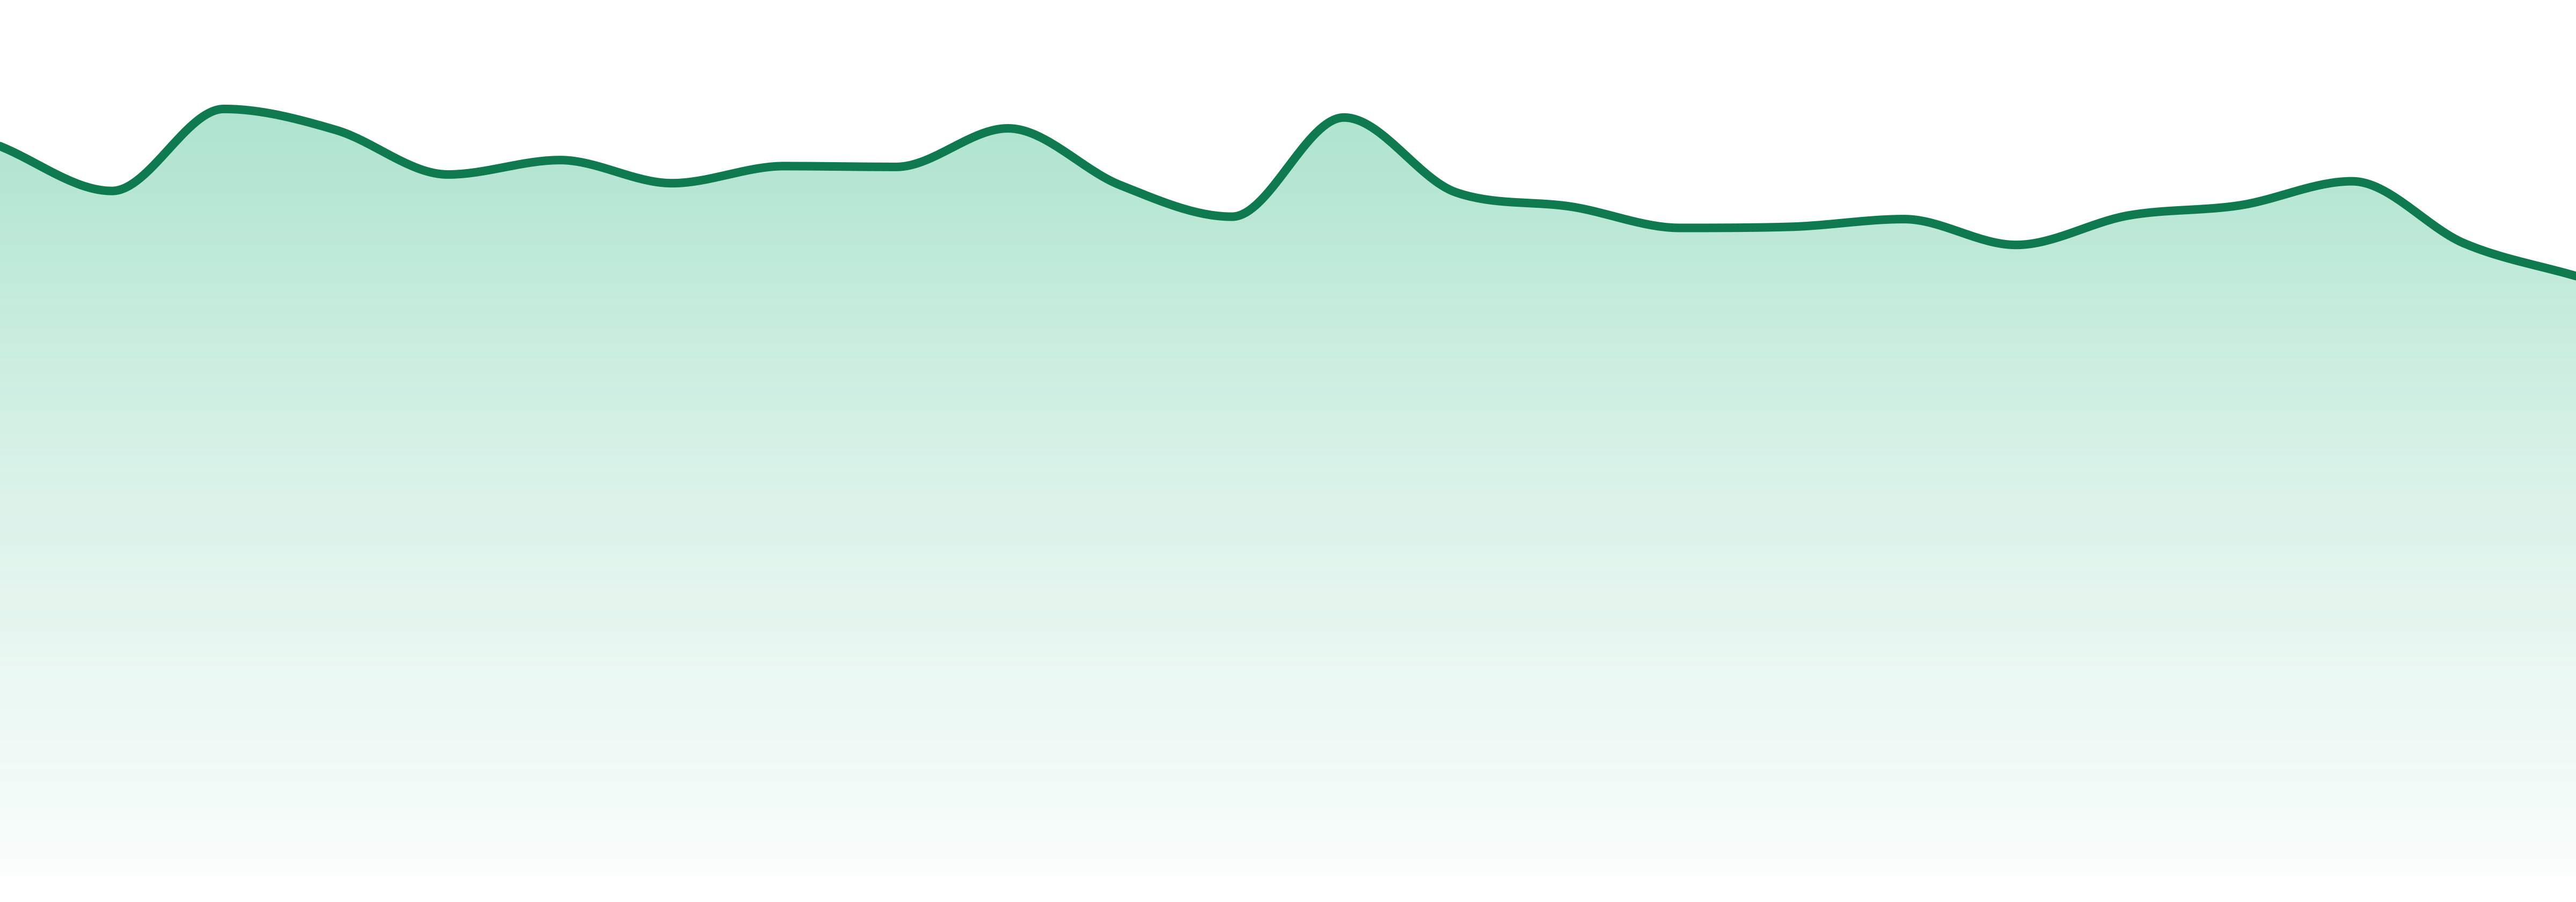
24-Month Trend
Average Price
$27.69
YoY Sales Trend
9.0%
2Y Sales Trend
9.6%
Topicals dominate at 39.2% but are down 6.0% YoY. Notably, Oral products are up 8.0% YoY, while Concentrates and Edibles see significant declines of 27.2% and 66.3%, respectively. Flower stands out with a remarkable 69.9% growth YoY.
| Category | Sales Share | Avg Price | YoY |
|---|---|---|---|
| Topicals | 39.2% | $30.08 | 6.0% |
| Oral | 35.2% | $23.15 | 8.0% |
| Concentrates | 25.2% | $32.73 | 27.2% |
AVEXIA's footprint is strongest in Illinois (34.2%) and New Jersey (17.8%), with a presence across 11 states. This concentration showcases its strategic positioning in key markets.
| State | Concentrates | Oral | Topicals |
|---|---|---|---|
| ⊖ | 2 | 1 | |
| 5 | 4 | 1 | |
| 17 | 2 | 1 | |
| 18 | 3 | 1 | |
| ⊖ | 9 | 7 |
Want SKU-Level Buyer Signals?
Unlock purchaser contacts, SKU-level velocity, and whitespace opportunities for this brand.
Market Position
Competitive LandscapeFeb 2026
AVEXIA maintains its #1 rank in Topicals but faced shifts, losing ground to PROGRESSIVE TREATMENT SOLUTIONS. Competing closely with peers like DOCTOR SOLOMON'S and UNWIND BY NGW, AVEXIA's competitive landscape is tightening.
SKU View
Notable ProductsFeb 2026
Top products for Feb 2026 with sales and momentum indicators.
| Product | Category | MoM |
|---|---|---|
#1 | Oral | 2.6% |
#2 | Topicals | 0.9% |
#3 | Topicals | 0.9% |
#4 | Oral | 5.2% |
#5 | Topicals | 2.1% |
#6 | Concentrates | 58.3% |
#7 | Oral | 21.8% |
#8 | Oral | 107.0% |
#9 | Concentrates | 46.3% |
#10 | Concentrates | 56.0% |
Benchmarking
Competitive Peer Set
Peer brands benchmarked against Avexia using competitive landscape rank coverage, proximity, and momentum.


