Is this your Brand? Log in to Hoodie!
Log in to HoodieTh3 Farm
Data Snapshot for Mar 19, 2026
Overview
With over 20 years of cultivating experience our master grower has cultivated some of the finest cannabis in the world. Our company is fortunate enough to have over 80 years combined experience within wholesale, retail, manufacturing, distribution, and of course cultivating. Here...
TH3 FARM's YoY growth surged 325.7%—a remarkable feat despite a recent 19.4% decline in the last 3 months. As a premium cannabis brand, it navigates a competitive landscape with a strategic focus on higher-value consumers.
Categories
- Top Category: Flower
- Price Tier: Premium
- States Active: 5
Top States
Th3 Farm Top StatesFeb 2026
Top states where Th3 Farm is active based on indexed sales coverage.
Trend View
Market Insights SnapshotFeb 2026
Trend narrative unavailable.
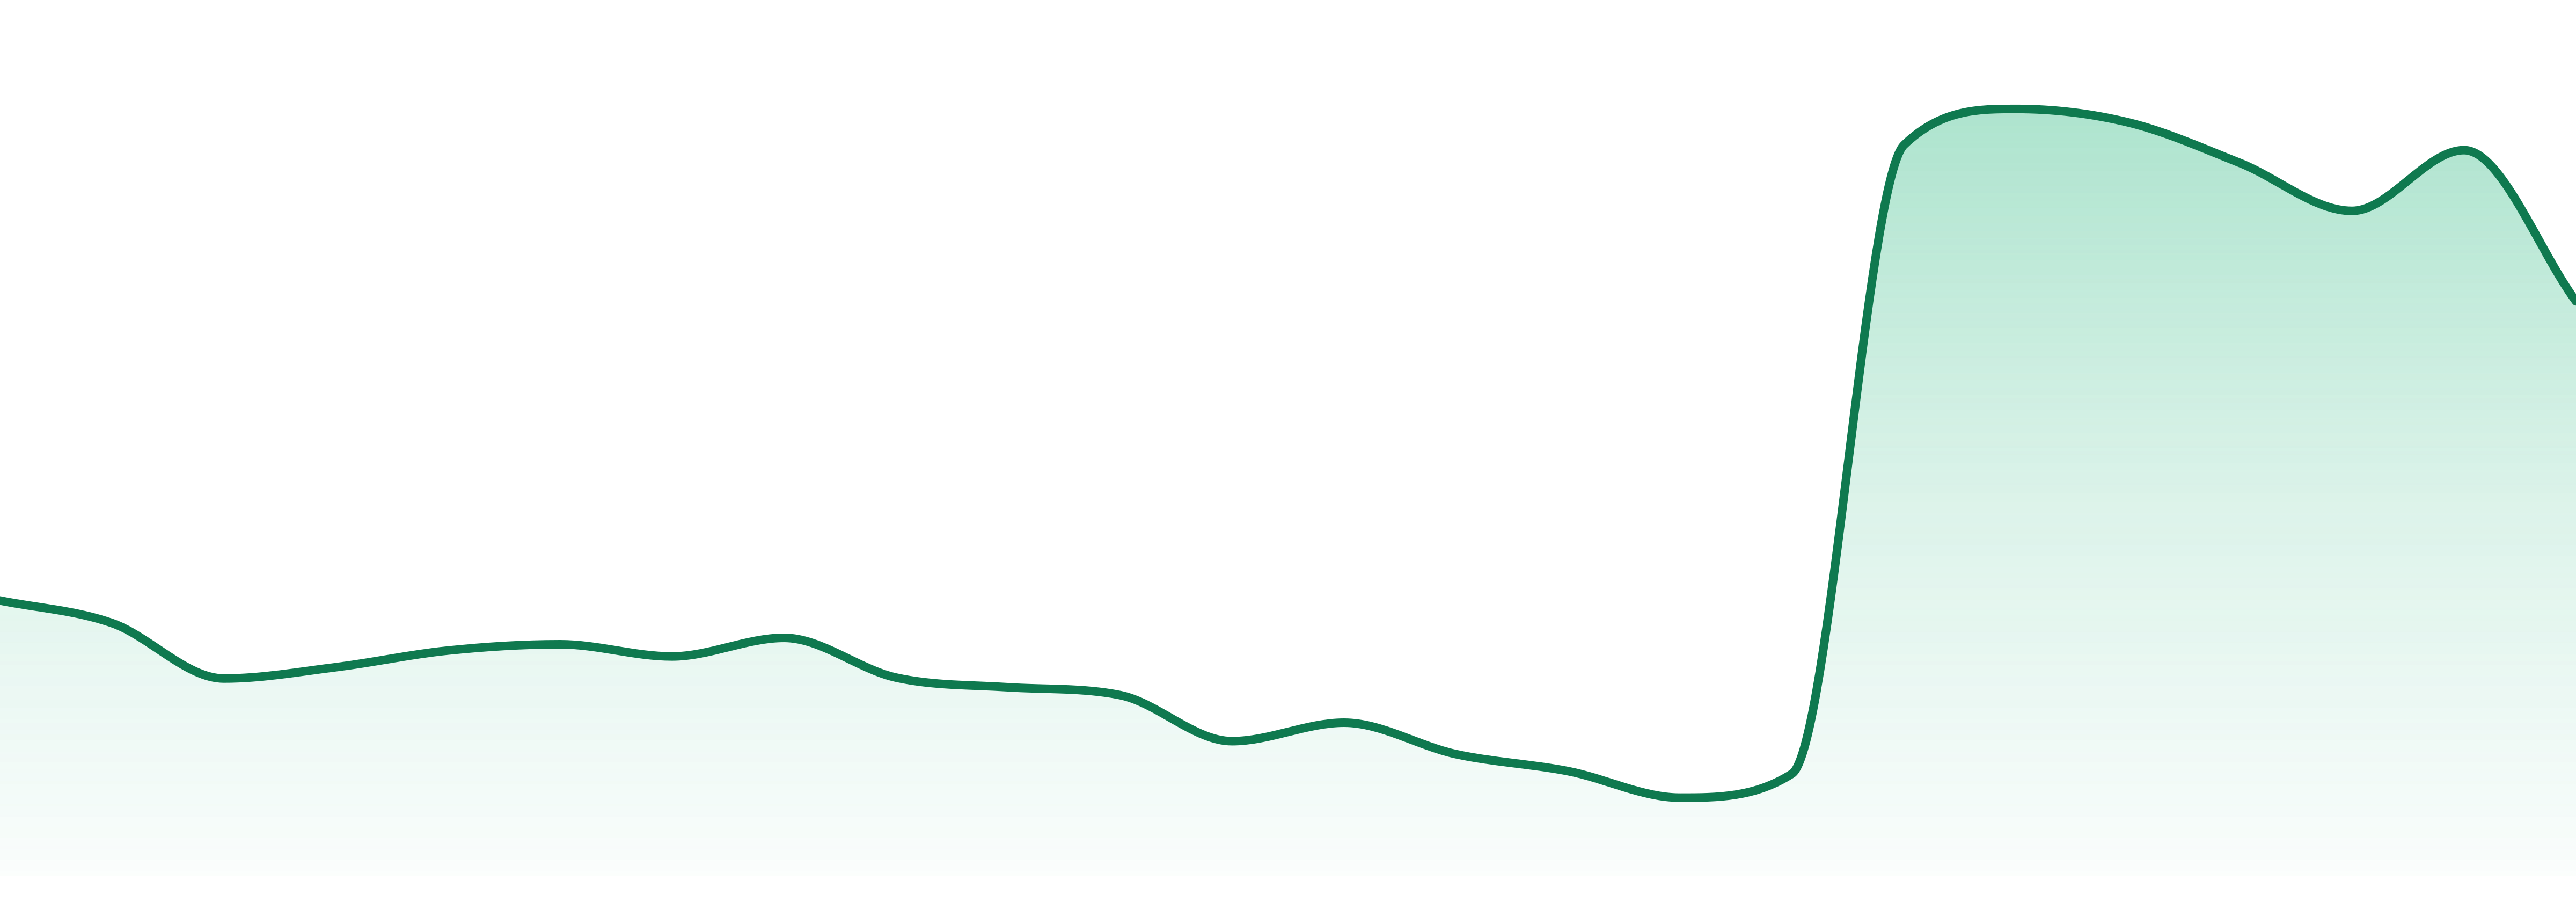
24-Month Trend
Average Price
$30.32
YoY Sales Trend
325.7%
2Y Sales Trend
126.7%
Vapes lead with explosive growth at +547.1% YoY, while Flower holds the largest share at 28.5% and +241.8% YoY. Pre-Rolls and Concentrates also show impressive gains at +458.3% and +455.2%, respectively.
| Category | Sales Share | Avg Price | YoY |
|---|---|---|---|
| Flower | 28.5% | $53.11 | 241.8% |
| Vapes | 24.5% | $55.42 | 547.1% |
| Pre-Rolls | 17.9% | $16.12 | 458.3% |
| Edibles | 12.9% | $15.23 | 267.3% |
| Concentrates | 10.3% | $42.35 | 455.2% |
| Oral | 5.2% | $53.51 | 86.1% |
TH3 FARM dominates in Delaware, capturing 99% of its sales there, with minimal presence in Oregon (0.6%) and Vermont (0.2%). Its geographic concentration underscores its stronghold in the Delaware market.
Want SKU-Level Buyer Signals?
Unlock purchaser contacts, SKU-level velocity, and whitespace opportunities for this brand.
Market Position
Competitive LandscapeFeb 2026
#4 in Flower, TH3 FARM is gaining ground against NATURE'S HERITAGE (#1) and SEED & STRAIN (#2). While it slipped from #3 to #4, it remains competitive, closing the gap with peers.
SKU View
Notable ProductsFeb 2026
Top products for Feb 2026 with sales and momentum indicators.
| Product | Category | MoM |
|---|---|---|
#1 | Flower | 2.0% |
#2 | Flower | 17.4% |
#3 | Vapes | 14.4% |
#4 | Flower | 43.2% |
#5 | Flower | 137.7% |
#6 | Vapes | 285.6% |
#7 | Pre-Rolls | 384.6% |
#8 | Pre-Rolls | 161.8% |
#9 | Vapes | 130.3% |
Benchmarking
Competitive Peer Set
Peer brands benchmarked against Th3 Farm using competitive landscape rank coverage, proximity, and momentum.


