Is this your Brand? Log in to Hoodie!
Log in to HoodieStation House
Data Snapshot for Mar 19, 2026
Overview
Rank slipped from #21 to #23 in Ontario. Sales down 9.8% over the last three months, with a 7.2% year-over-year decline, revealing significant pricing pressures in a low-tier market.
Categories
- Top Category: Pre-Rolls
- Price Tier: Value
- States Active: 6
Top States
Station House Top StatesFeb 2026
Top states where Station House is active based on indexed sales coverage.
Trend View
Market Insights SnapshotFeb 2026
Trend narrative unavailable.
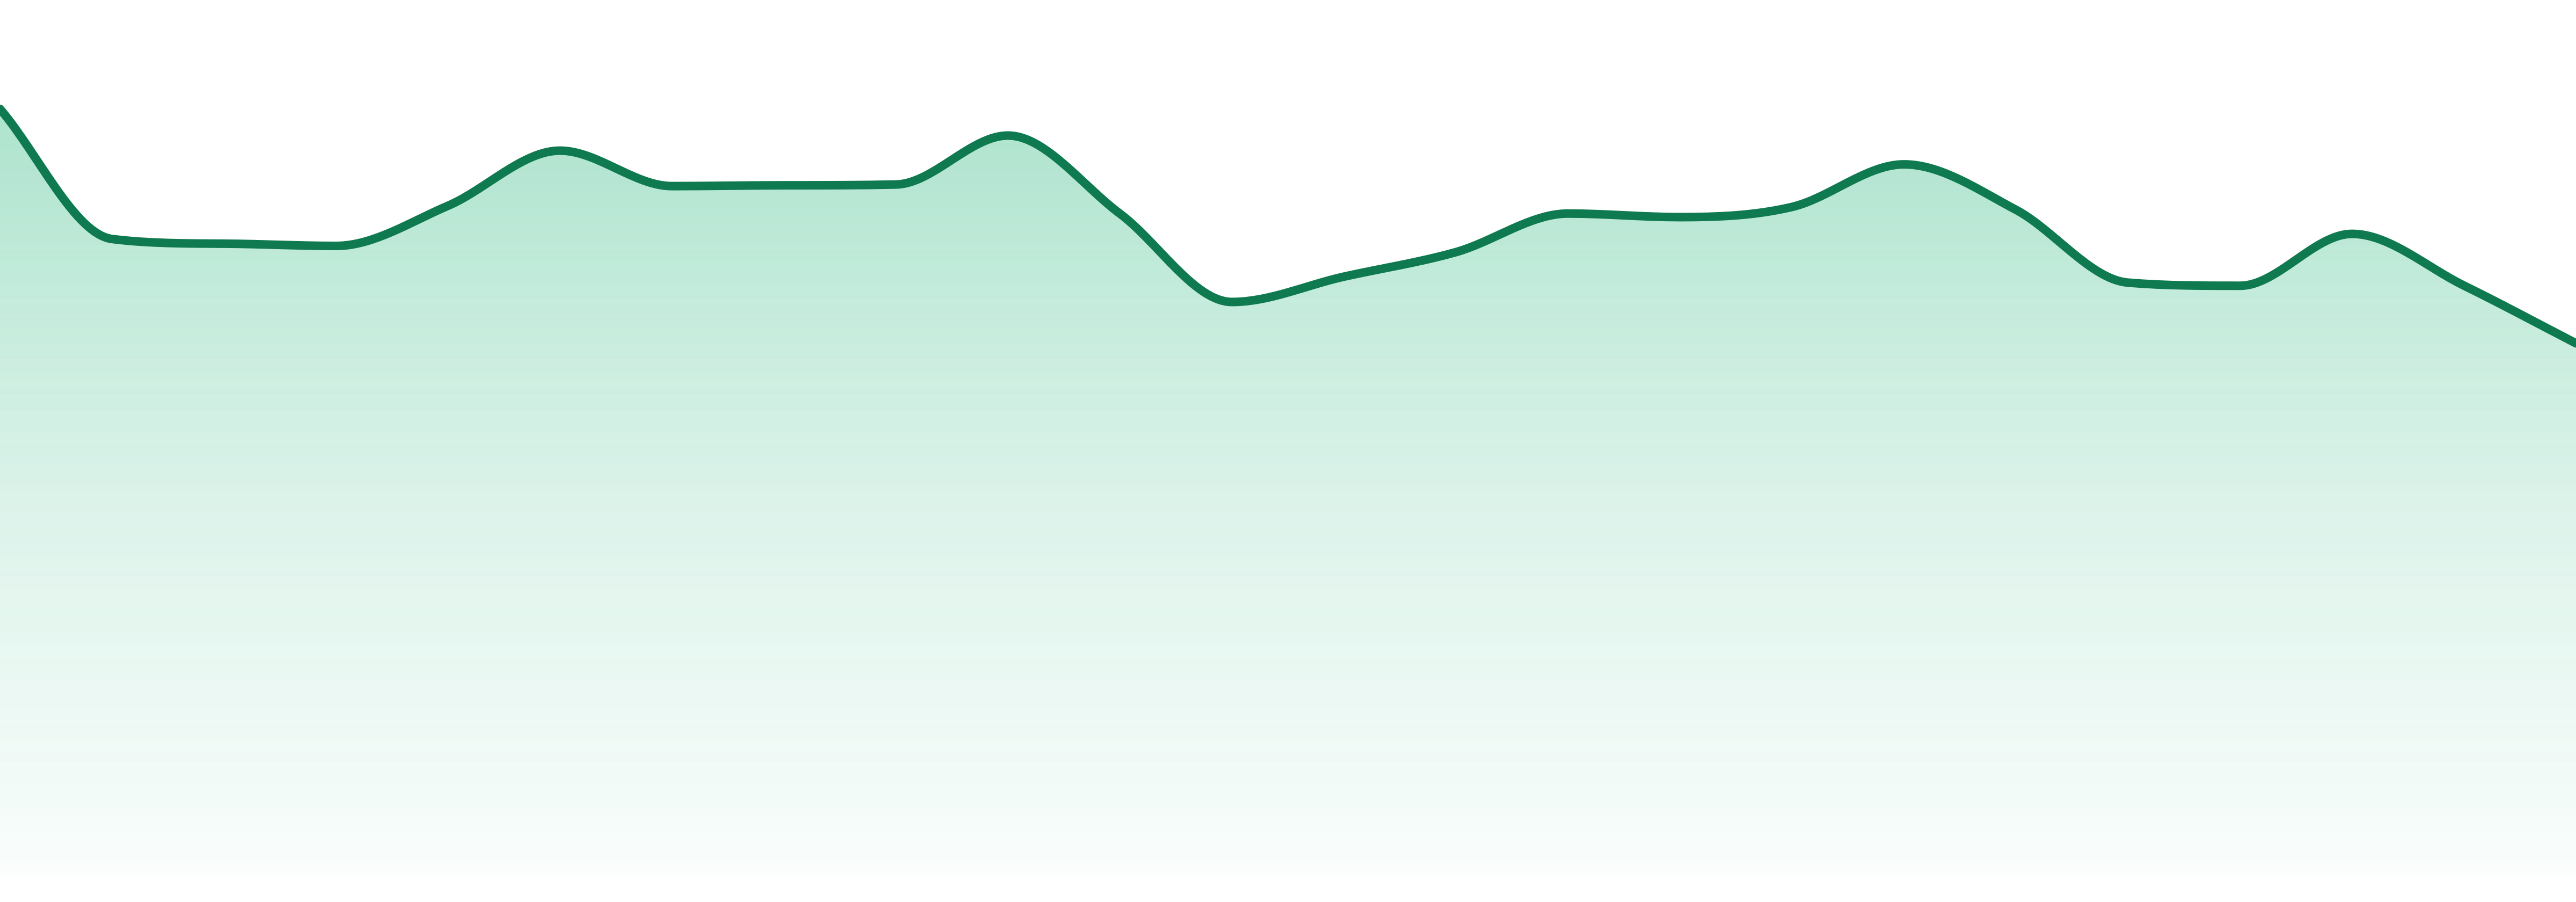
24-Month Trend
Average Price
$9.06
YoY Sales Trend
7.2%
2Y Sales Trend
32.3%
Pre-Rolls lead at 78.4% of sales, but down 6.4% YoY. Flower holds 21.0% with a 9.7% YoY drop, while Concentrates face the steepest decline at 21.4% YoY.
| Category | Sales Share | Avg Price | YoY |
|---|---|---|---|
| Pre-Rolls | 78.8% | $8.5 | 6.4% |
| Flower | 21.1% | $12.15 | 9.7% |
STATION HOUSE is strongest in Ontario (61.4%) and British Columbia (28.4%), with a presence in six states overall.
| State | Flower | Pre-Roll |
|---|---|---|
| 32 | 18 | |
| 48 | 24 | |
| ⊖ | 16 | |
| ⊖ | 23 | |
| ⊖ | ⊖ |
Want SKU-Level Buyer Signals?
Unlock purchaser contacts, SKU-level velocity, and whitespace opportunities for this brand.
Market Position
Competitive LandscapeFeb 2026
Competitive summary unavailable.
SKU View
Notable ProductsFeb 2026
Top products for Feb 2026 with sales and momentum indicators.
| Product | Category | MoM |
|---|---|---|
#1 | Flower | N/A |
#2 | Flower | N/A |
#3 | Pre-Rolls | N/A |
#4 | Flower | N/A |
#5 | Pre-Rolls | 8.6% |
#6 | Flower | 6.7% |
#7 | Flower | 31.6% |
#8 | Pre-Rolls | 20.0% |
#9 | Other | 27.6% |
Benchmarking
Competitive Peer Set
Peer brands benchmarked against Station House using competitive landscape rank coverage, proximity, and momentum.


