Is this your Brand? Log in to Hoodie!
Log in to HoodieSolei
Data Snapshot for Mar 19, 2026
Overview
SOLEI's YoY growth has dropped 29.1%, reflecting a challenging market landscape. Despite this, the brand has improved its rank from #114 to #107, maintaining its position in the 250-500K tier. Its presence remains significant, selling 30.5K units amidst adversity.
Categories
- Top Category: Pre-Rolls
- Price Tier: Value
- States Active: 8
Top States
Solei Top StatesFeb 2026
Top states where Solei is active based on indexed sales coverage.
Trend View
Market Insights SnapshotFeb 2026
Trend narrative unavailable.
24-Month Trend
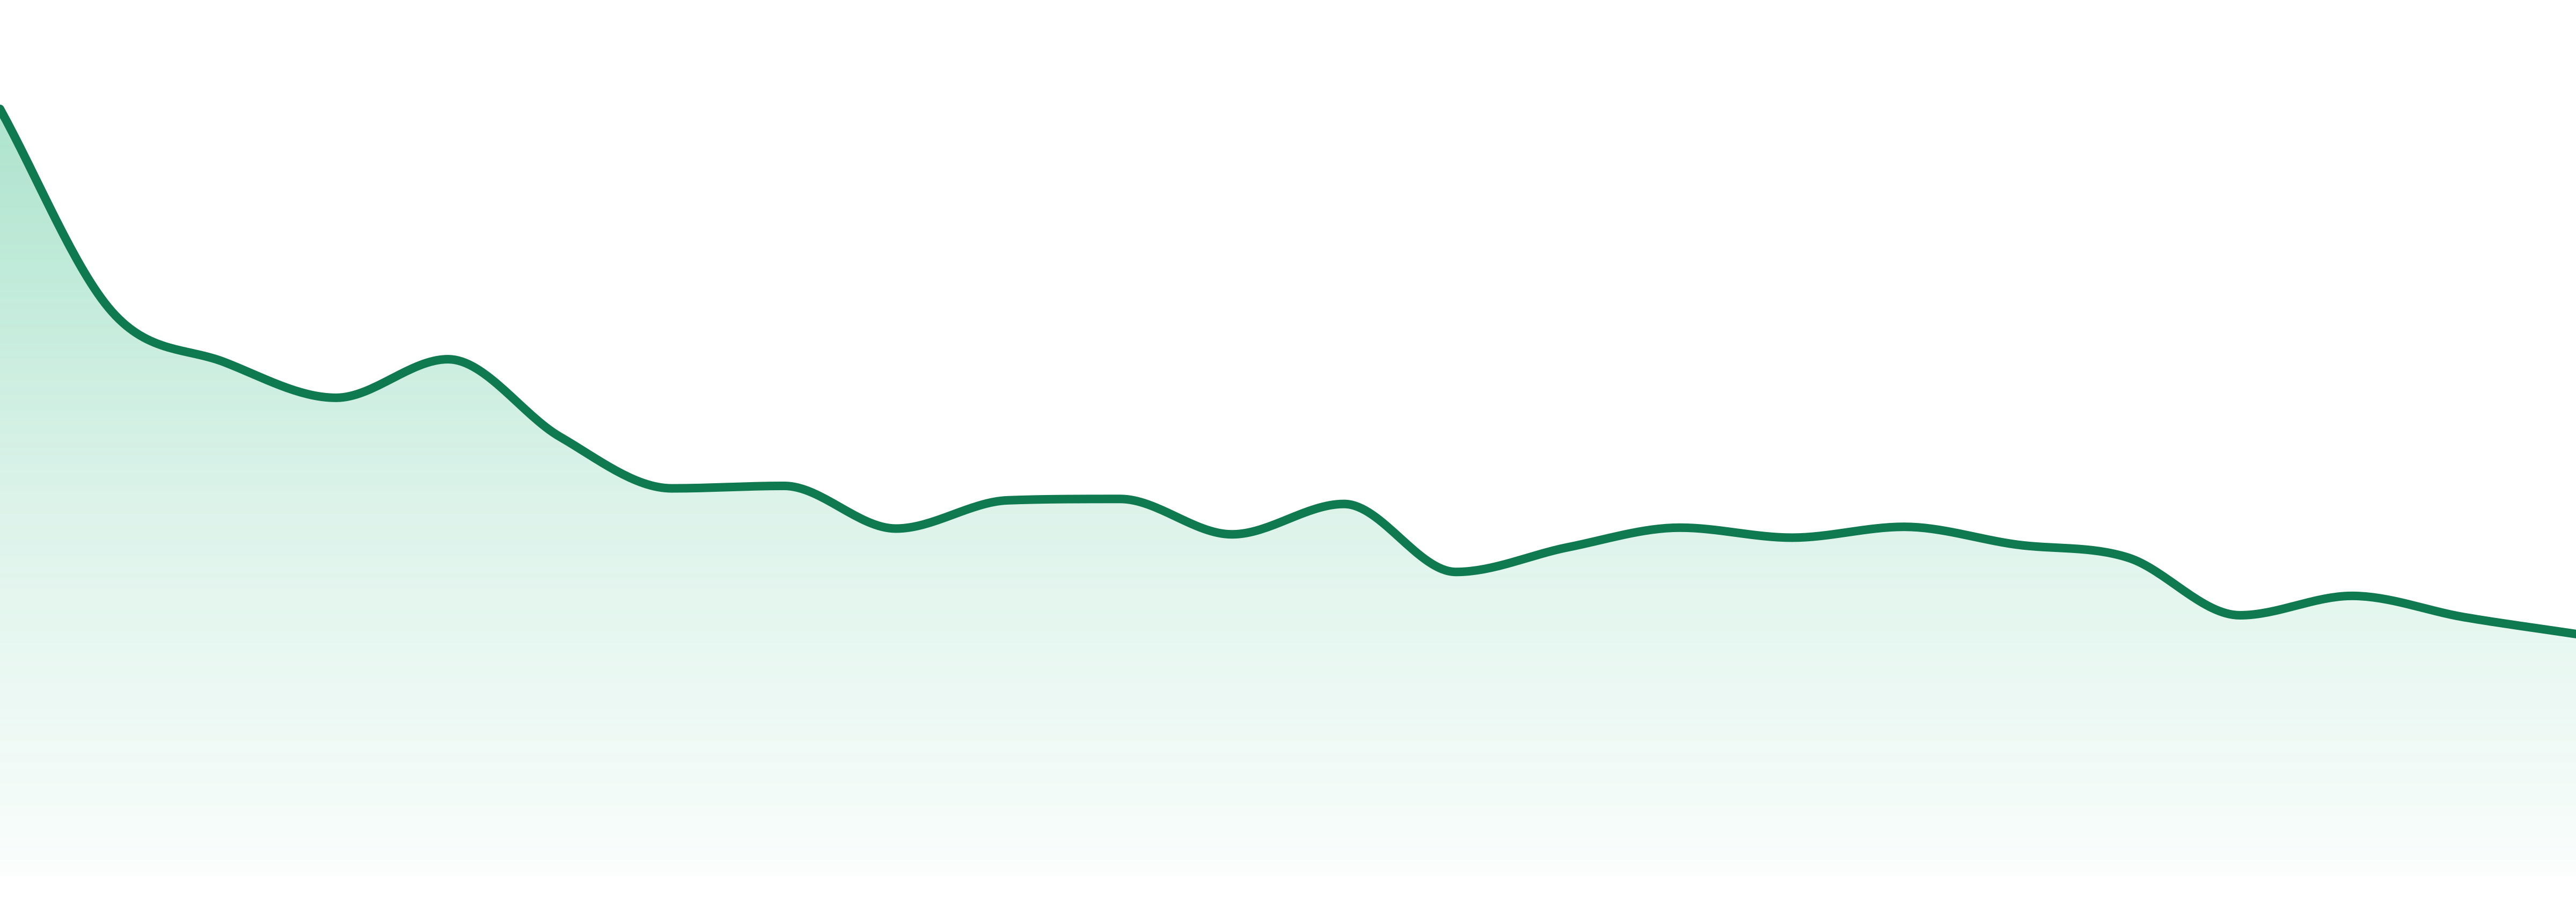
Average Price
$9.99
YoY Sales Trend
29.1%
2Y Sales Trend
70.2%
Pre-Rolls lead SOLEI's offerings at 50.3%, with a slight YoY increase of 0.4%. In contrast, Edibles have seen a steep decline of 29.1%, while Topicals plummet by 71.6%. The variance highlights the shifting consumer preferences within the category.
| Category | Sales Share | Avg Price | YoY |
|---|---|---|---|
| Pre-Rolls | 50.3% | $14.42 | 0.4% |
| Edibles | 27.4% | $7.19 | 29.1% |
| Topicals | 11.0% | $10.48 | 71.6% |
| Oral | 7.6% | $22.02 | 15.4% |
| Flower | 1.7% | $1.4 | 13.8% |
SOLEI's market presence is strongest in Ontario (41%), Alberta (27%), and British Columbia (23.3%), actively competing across 8 states. This geographic distribution showcases its reach in the Canadian cannabis market.
| State | Edibles | Flower | Oral | Pre-Roll | Topicals |
|---|---|---|---|---|---|
| 32 | ⊖ | 9 | 42 | 3 | |
| 26 | 35 | ⊖ | ⊖ | 3 | |
| 17 | ⊖ | 35 | 44 | 5 | |
| 28 | ⊖ | 11 | ⊖ | 2 | |
| 20 | ⊖ | 12 | ⊖ | 5 |
Want SKU-Level Buyer Signals?
Unlock purchaser contacts, SKU-level velocity, and whitespace opportunities for this brand.
Market Position
Competitive LandscapeFeb 2026
Ranked #107 in the competitive landscape, SOLEI trails behind leading brands like HYCYCLE and NULL in the Pre-Rolls category. Despite losing ground against GENERAL ADMISSION and BACK FORTY, it has improved its rank from #114 to #107, maintaining relevance.
SKU View
Notable ProductsFeb 2026
Top products for Feb 2026 with sales and momentum indicators.
| Product | Category | MoM |
|---|---|---|
#1 | Topicals | 3.3% |
#2 | Topicals | 3.2% |
#3 | Accessories | 3.1% |
#4 | Pre-Rolls | 16.9% |
#5 | Pre-Rolls | 0.7% |
#6 | Edibles | 452.9% |
#7 | Edibles | 84.3% |
#8 | Edibles | 62.3% |
#9 | Pre-Rolls | 46.7% |
#10 | Pre-Rolls | 142.7% |
Benchmarking
Competitive Peer Set
Peer brands benchmarked against Solei using competitive landscape rank coverage, proximity, and momentum.


