Is this your Brand? Log in to Hoodie!
Log in to HoodieJelly Roll
Data Snapshot for Mar 19, 2026
Overview
JELLY ROLL boasts an impressive YoY growth of 47.5%, elevating its rank from #10 to #8 in Missouri. Positioned in the mid-tier, the brand's sales trend remains stable, with no change over the past three months.
Categories
- Top Category: Pre-Rolls
- Price Tier: Mid-Market
- States Active: 2
Top States
Jelly Roll Top StatesFeb 2026
Top states where Jelly Roll is active based on indexed sales coverage.
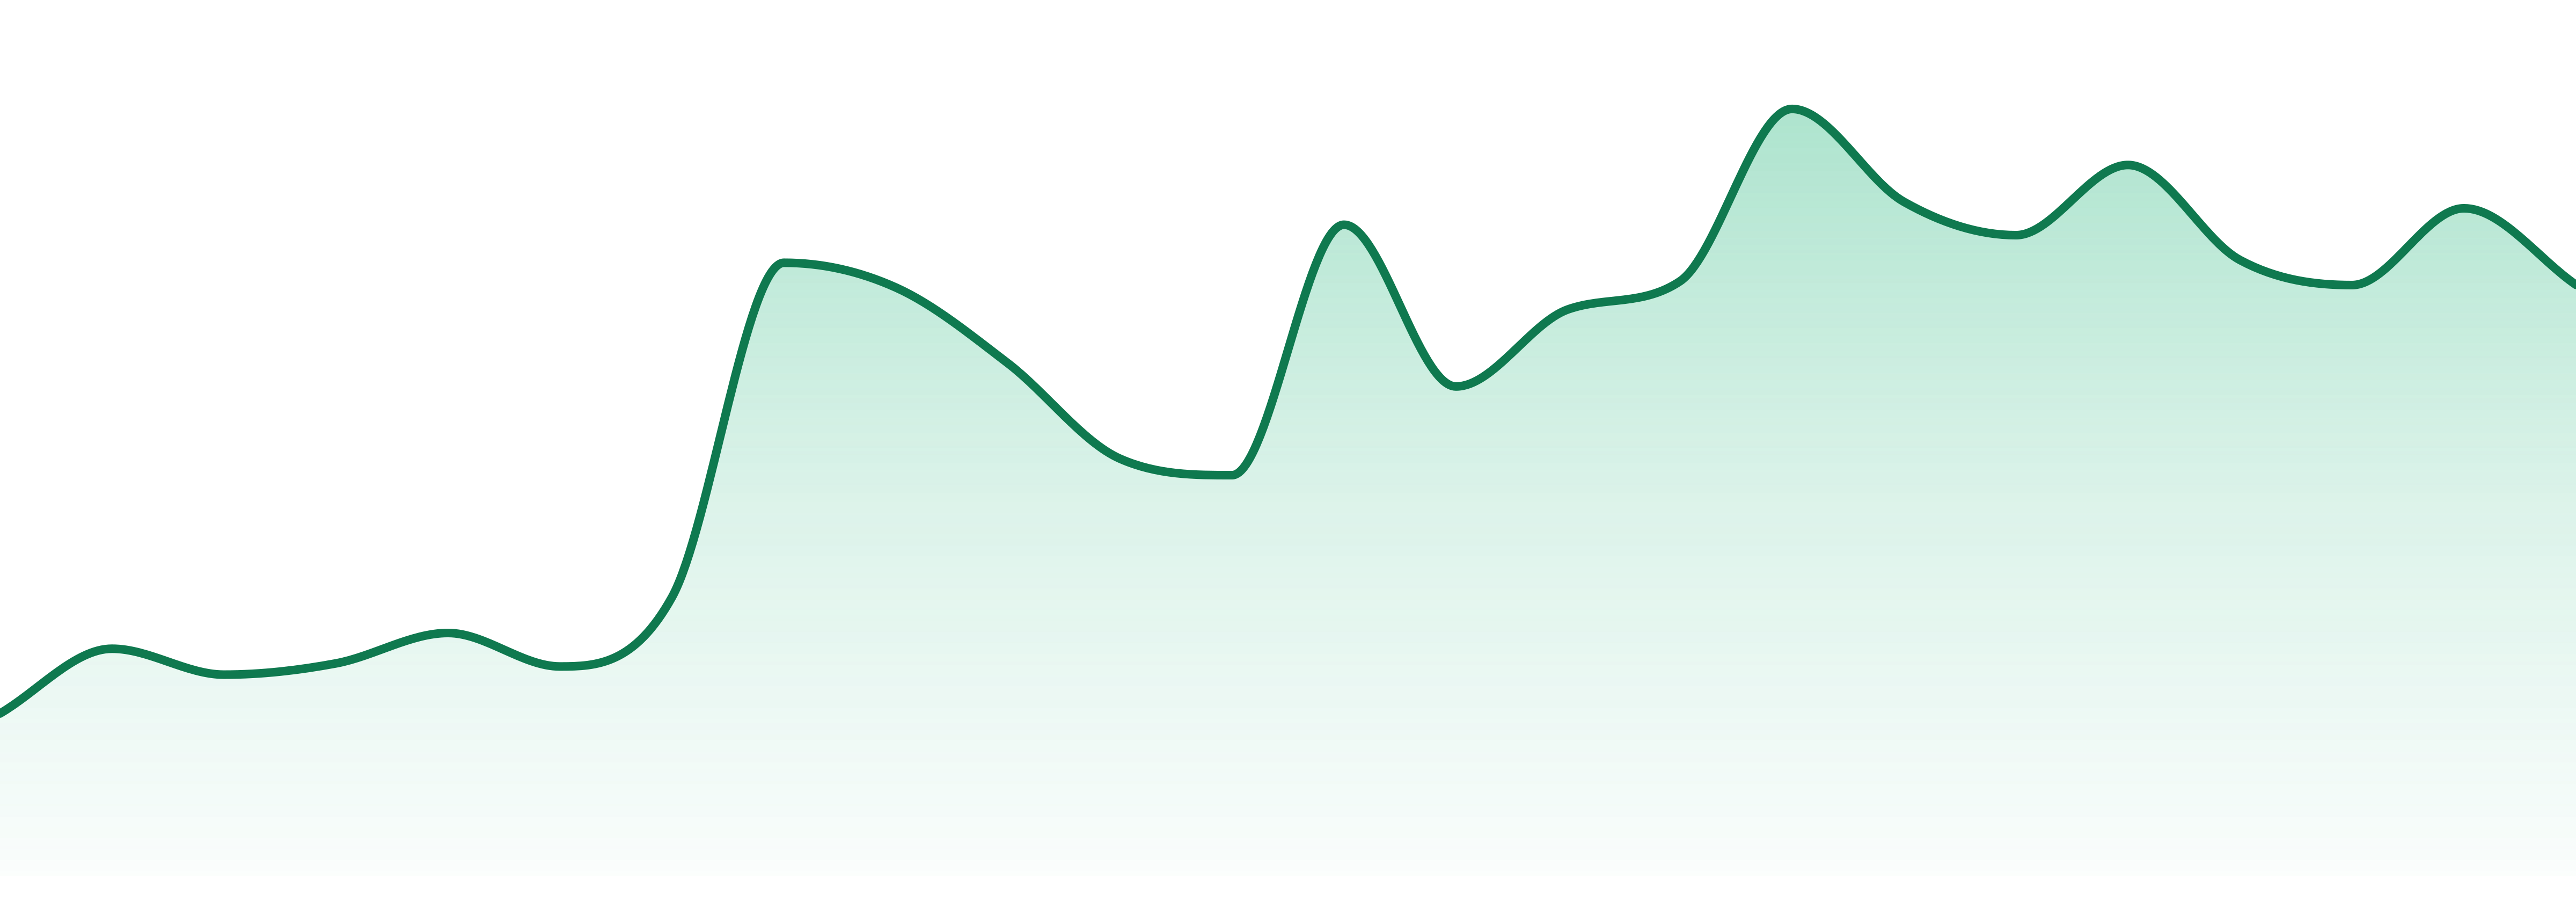
Trend View
Market Insights SnapshotFeb 2026
Trend narrative unavailable.
24-Month Trend
Average Price
$16.02
YoY Sales Trend
47.5%
2Y Sales Trend
226.9%
Pre-Rolls dominate the category at 100% of sales, showcasing significant growth at +47.5% YoY. This category is not only the largest but also the fastest-growing segment.
| Category | Sales Share | Avg Price | YoY |
|---|---|---|---|
| Pre-Rolls | 100.0% | $16.02 | 47.5% |
JELLY ROLL is concentrated entirely in Missouri, capturing 100% of its sales there. Washington contributes no sales, highlighting a focused geographic footprint.
| State | Pre-Roll |
|---|---|
| 8 | |
| ⊖ |
Want SKU-Level Buyer Signals?
Unlock purchaser contacts, SKU-level velocity, and whitespace opportunities for this brand.
Market Position
Competitive LandscapeFeb 2026
Ranked #8 in the competitive Pre-Rolls category, JELLY ROLL is 7 spots behind market leader GOOD DAY FARM. The brand's rank has improved from #10 to #8 in the past year, but it remains behind key competitors like CODES. and JEETER.
SKU View
Notable ProductsFeb 2026
Top products for Feb 2026 with sales and momentum indicators.
| Product | Category | MoM |
|---|---|---|
#1 | Pre-Rolls | 38.3% |
#2 | Pre-Rolls | 34.1% |
#3 | Pre-Rolls | 197.7% |
#4 | Pre-Rolls | 1.1% |
#5 | Pre-Rolls | 12.5% |
#6 | Pre-Rolls | 46.3% |
#7 | Pre-Rolls | 47.8% |
#8 | Pre-Rolls | 34.7% |
Benchmarking
Competitive Peer Set
Peer brands benchmarked against Jelly Roll using competitive landscape rank coverage, proximity, and momentum.


