Is this your Brand? Log in to Hoodie!
Log in to HoodieHeights
Data Snapshot for Mar 19, 2026
Overview
Elevate your cannabis experience with Heights, where we offer a adventurous selection of premium THC-infused chocolates, mints, and fruit chews. Indulge in delicious flavors as you discover a new heights with every bite.
HEIGHTS is in the .5M-1M tier, with an impressive 73.0% YoY growth. Despite a 10.9% decline over the last three months, unit volume increased significantly, suggesting a strategic shift in pricing or product appeal.
Categories
- Top Category: Edibles
- Price Tier: Value
- States Active: 6
Top States
Heights Top StatesFeb 2026
Top states where Heights is active based on indexed sales coverage.
Trend View
Market Insights SnapshotFeb 2026
Trend narrative unavailable.
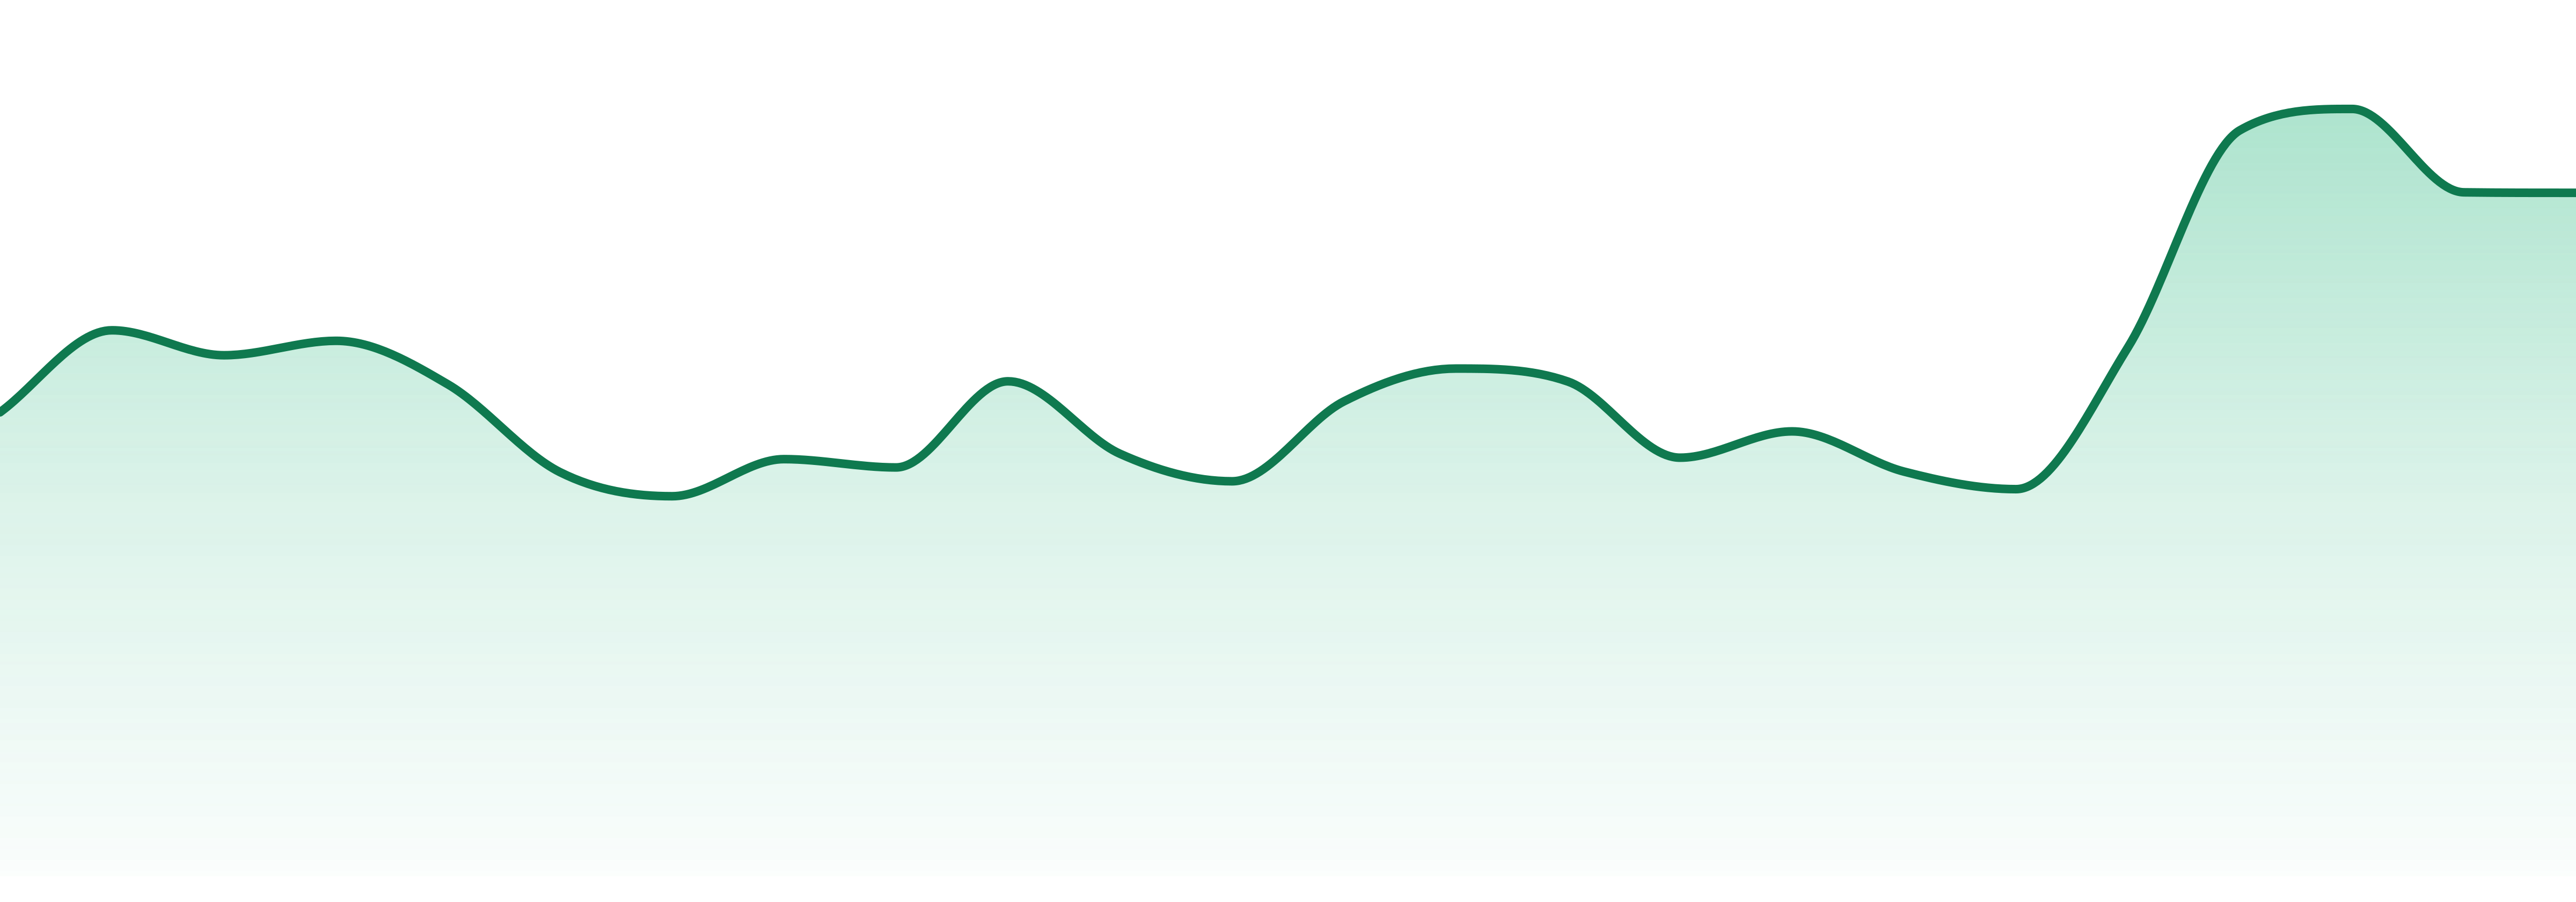
24-Month Trend
Average Price
$10.62
YoY Sales Trend
73.0%
2Y Sales Trend
45.5%
Edibles dominate at 98.7% of sales, soaring +70.8% YoY, while Flower struggles at 0.0%, down -39.9%. This stark contrast highlights the market's shift towards Edibles as the leading category.
| Category | Sales Share | Avg Price | YoY |
|---|---|---|---|
| Edibles | 98.7% | $10.53 | 70.8% |
Florida leads with 73.1% of sales, followed by Massachusetts at 18.3% and Texas at 7.2%. HEIGHTS maintains a strong foothold across 6 states, showcasing high geographic concentration.
| State | Edibles |
|---|---|
| 2 | |
| 6 | |
| 29 | |
| ⊖ |
Want SKU-Level Buyer Signals?
Unlock purchaser contacts, SKU-level velocity, and whitespace opportunities for this brand.
Market Position
Competitive LandscapeFeb 2026
HEIGHTS ranks #6 in Edibles, improving from #11 in the past year. Competing against leaders like SWEET TALK and JAMS, HEIGHTS is gaining ground, notably holding the #2 position in Texas.
SKU View
Notable ProductsFeb 2026
Top products for Feb 2026 with sales and momentum indicators.
| Product | Category | MoM |
|---|---|---|
#1 | Edibles | 25.8% |
#2 | Edibles | 6.8% |
#3 | Edibles | 2.7% |
#4 | Edibles | 14.7% |
#5 | Edibles | 8.4% |
#6 | Edibles | 5.0% |
#7 | Edibles | 1.8% |
#8 | Edibles | 3.3% |
Benchmarking
Competitive Peer Set
Peer brands benchmarked against Heights using competitive landscape rank coverage, proximity, and momentum.


