Is this your Brand? Log in to Hoodie!
Log in to HoodieDavinci
Data Snapshot for Mar 19, 2026
Overview
Inspired by the vision and tenacity of Renaissance innovator Leonardo da Vinci, Cortney Smith founded DaVinci Tech in 2011 with the desire to change the worlds imagination.Like its namesake, DaVinci Tech is known for relentless innovation. The dreamers behind the brand never stop...
DAVINCI surged with a 24.7% YoY growth, climbing from rank #252 to #1 in Ontario. Despite a 27.6% dip in the last three months, the brand's mid-tier positioning remains strong, indicating a resilient strategy amidst market fluctuations.
Categories
- Top Category: Accessories
- Price Tier: Mid-Market
- States Active: 30
Top States
Davinci Top StatesFeb 2026
Top states where Davinci is active based on indexed sales coverage.
Trend View
Market Insights SnapshotFeb 2026
Trend narrative unavailable.
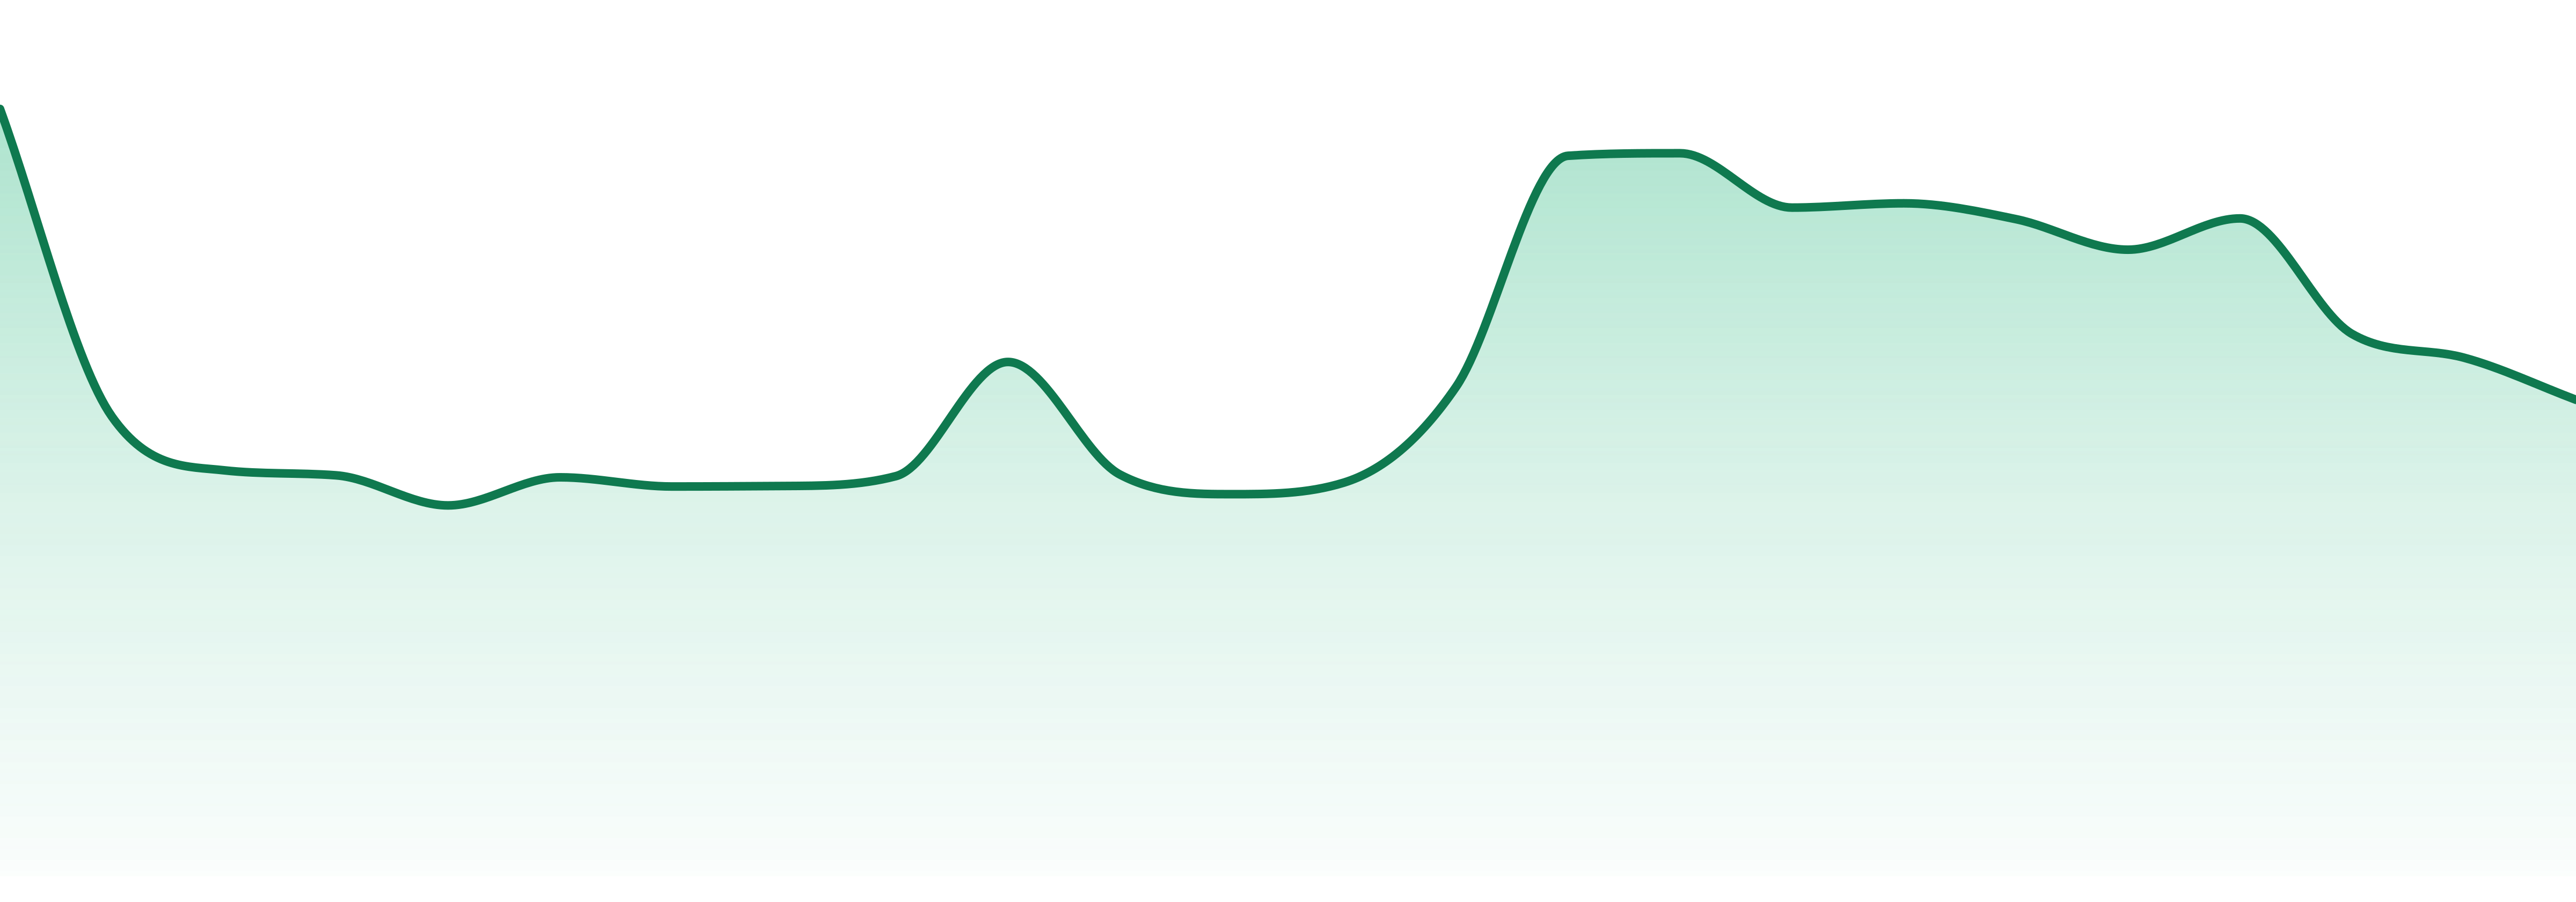
24-Month Trend
Average Price
$23.44
YoY Sales Trend
24.7%
2Y Sales Trend
54.1%
Accessories dominate with 100% of sales, showcasing a remarkable 25.3% YoY increase. In contrast, Vapes and Concentrates have plummeted to 0%, reflecting a significant shift in consumer preferences.
| Category | Sales Share | Avg Price | YoY |
|---|---|---|---|
| Accessories | 100.0% | $23.44 | 25.3% |
DAVINCI leads in Alberta at 44.5% and Florida at 34.0%, showcasing strong geographical concentration. The brand operates across 30 states, enhancing its footprint in the cannabis market.
| State | Accessories |
|---|---|
| 5 | |
| 7 | |
| 11 | |
| 13 | |
| 16 |
Want SKU-Level Buyer Signals?
Unlock purchaser contacts, SKU-level velocity, and whitespace opportunities for this brand.
Market Position
Competitive LandscapeFeb 2026
#1 in Vapes, DAVINCI outperforms peers like BACK FORTY and SPINACH. With a dramatic rise in rank from #252 to #1, the competition is intensifying as DAVINCI solidifies its market leadership.
SKU View
Notable ProductsFeb 2026
Top products for Feb 2026 with sales and momentum indicators.
| Product | Category | MoM |
|---|---|---|
#1 | Vapes | N/A |
#2 | Accessories | 11.4% |
#3 | Accessories | 7.8% |
#4 | Accessories | 5.7% |
#5 | Accessories | 22.5% |
#6 | Accessories | 73.0% |
Benchmarking
Competitive Peer Set
Peer brands benchmarked against Davinci using competitive landscape rank coverage, proximity, and momentum.


