Is this your Brand? Log in to Hoodie!
Log in to HoodieCare Division
Data Snapshot for Mar 19, 2026
Overview
Living today can get pretty exhausting. You need to feel and look as amazing as we know you are, even when times are tough. Whether it's pain, skincare, or just every day bad vibes--Care Division creates solutions. Inspired by ayurvedic medicine, but including modern science, all...
CARE DIVISION's sales plummeted 44.8% YoY, highlighting significant struggles within the <250K tier. With a 20% decline over the past three months, the brand faces intensified competition and market challenges.
Categories
- Top Category: Topicals
- Price Tier: Premium
- States Active: 2
Top States
Care Division Top StatesFeb 2026
Top states where Care Division is active based on indexed sales coverage.
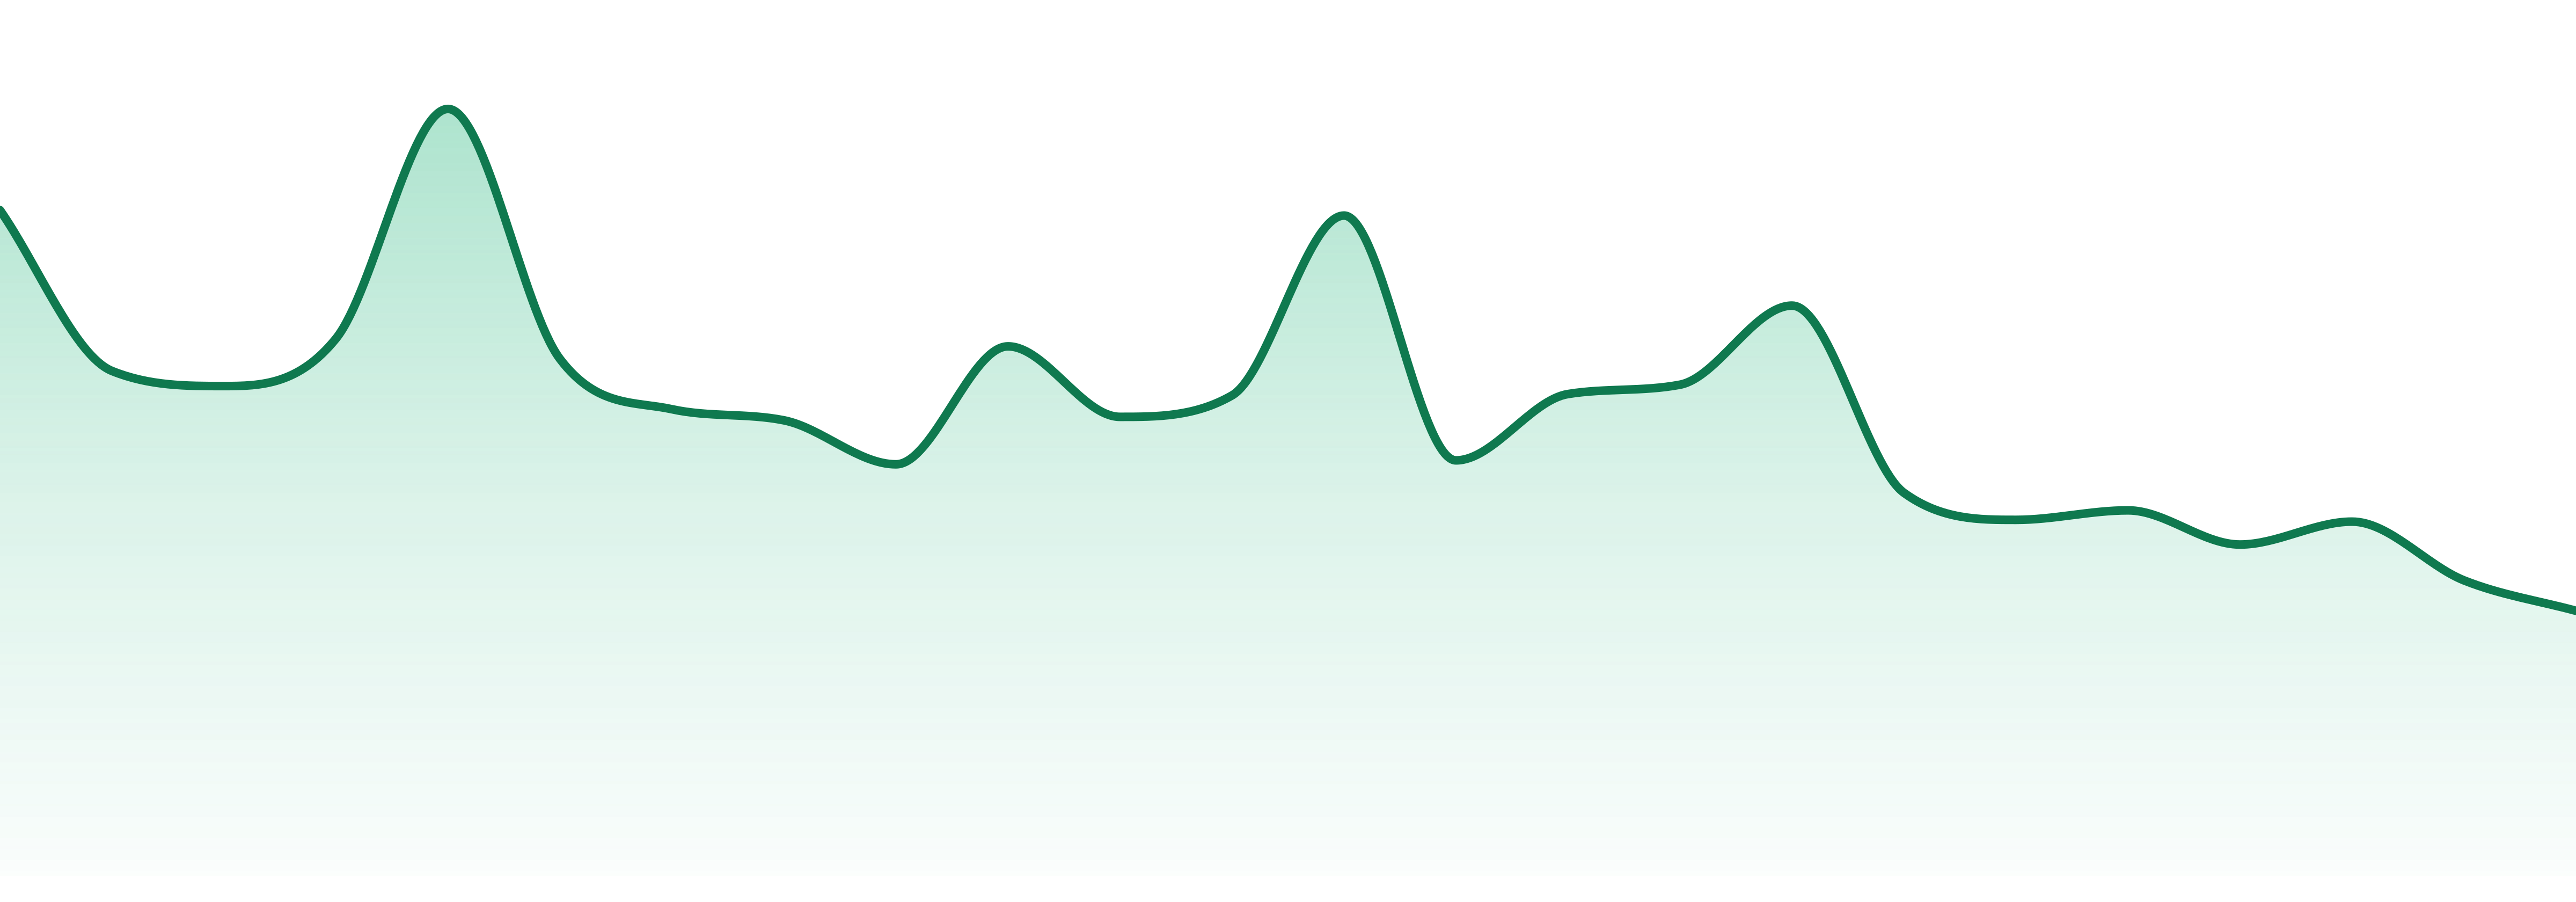
Trend View
Market Insights SnapshotFeb 2026
Trend narrative unavailable.
24-Month Trend
Average Price
$39.84
YoY Sales Trend
44.8%
2Y Sales Trend
55.2%
Topicals dominate at 49.6% but are down 46.1% YoY. CBD is the only bright spot, growing 13.3% YoY, while Edibles suffered the steepest decline at 65.8%.
| Category | Sales Share | Avg Price | YoY |
|---|---|---|---|
| Topicals | 52.8% | $49.28 | 46.1% |
| Oral | 37.4% | $34.81 | 39.3% |
| Cbd | 4.7% | $34.89 | 13.3% |
| Edibles | 3.8% | $28.61 | 65.8% |
CARE DIVISION holds a strong foothold in Colorado, accounting for 100% of sales, with a minor presence in Michigan. Geographic concentration is high, limiting broader market reach.
Want SKU-Level Buyer Signals?
Unlock purchaser contacts, SKU-level velocity, and whitespace opportunities for this brand.
Market Position
Competitive LandscapeFeb 2026
#3 in Topicals, CARE DIVISION is closing in on #2 MARY JANE'S MEDICINALS while trailing #1 ESCAPE ARTISTS. The brand improved its rank from #4 to #3 over the past year.
SKU View
Notable ProductsFeb 2026
Top products for Feb 2026 with sales and momentum indicators.
| Product | Category | MoM |
|---|---|---|
#1 | Topicals | 0.1% |
#2 | Topicals | 16.8% |
#3 | Topicals | 39.8% |
#4 | Topicals | 6.4% |
#5 | Oral | 24.9% |
#6 | Other | 45.6% |
#7 | Topicals | 63.4% |
#8 | Topicals | 8.0% |
Benchmarking
Competitive Peer Set
Peer brands benchmarked against Care Division using competitive landscape rank coverage, proximity, and momentum.


