Is this your Brand? Log in to Hoodie!
Log in to HoodieCanna Punch
Data Snapshot for Mar 19, 2026
Overview
CANNA PUNCH's sales plummeted 41.4% YoY, with a notable decline in unit volume. Mid-tier pricing strategy appears to be under pressure, with a 1.2% drop in the last three months signaling potential challenges ahead.
Categories
- Top Category: Edibles
- Price Tier: Mid-Market
- States Active: 2
Top States
Canna Punch Top StatesFeb 2026
Top states where Canna Punch is active based on indexed sales coverage.
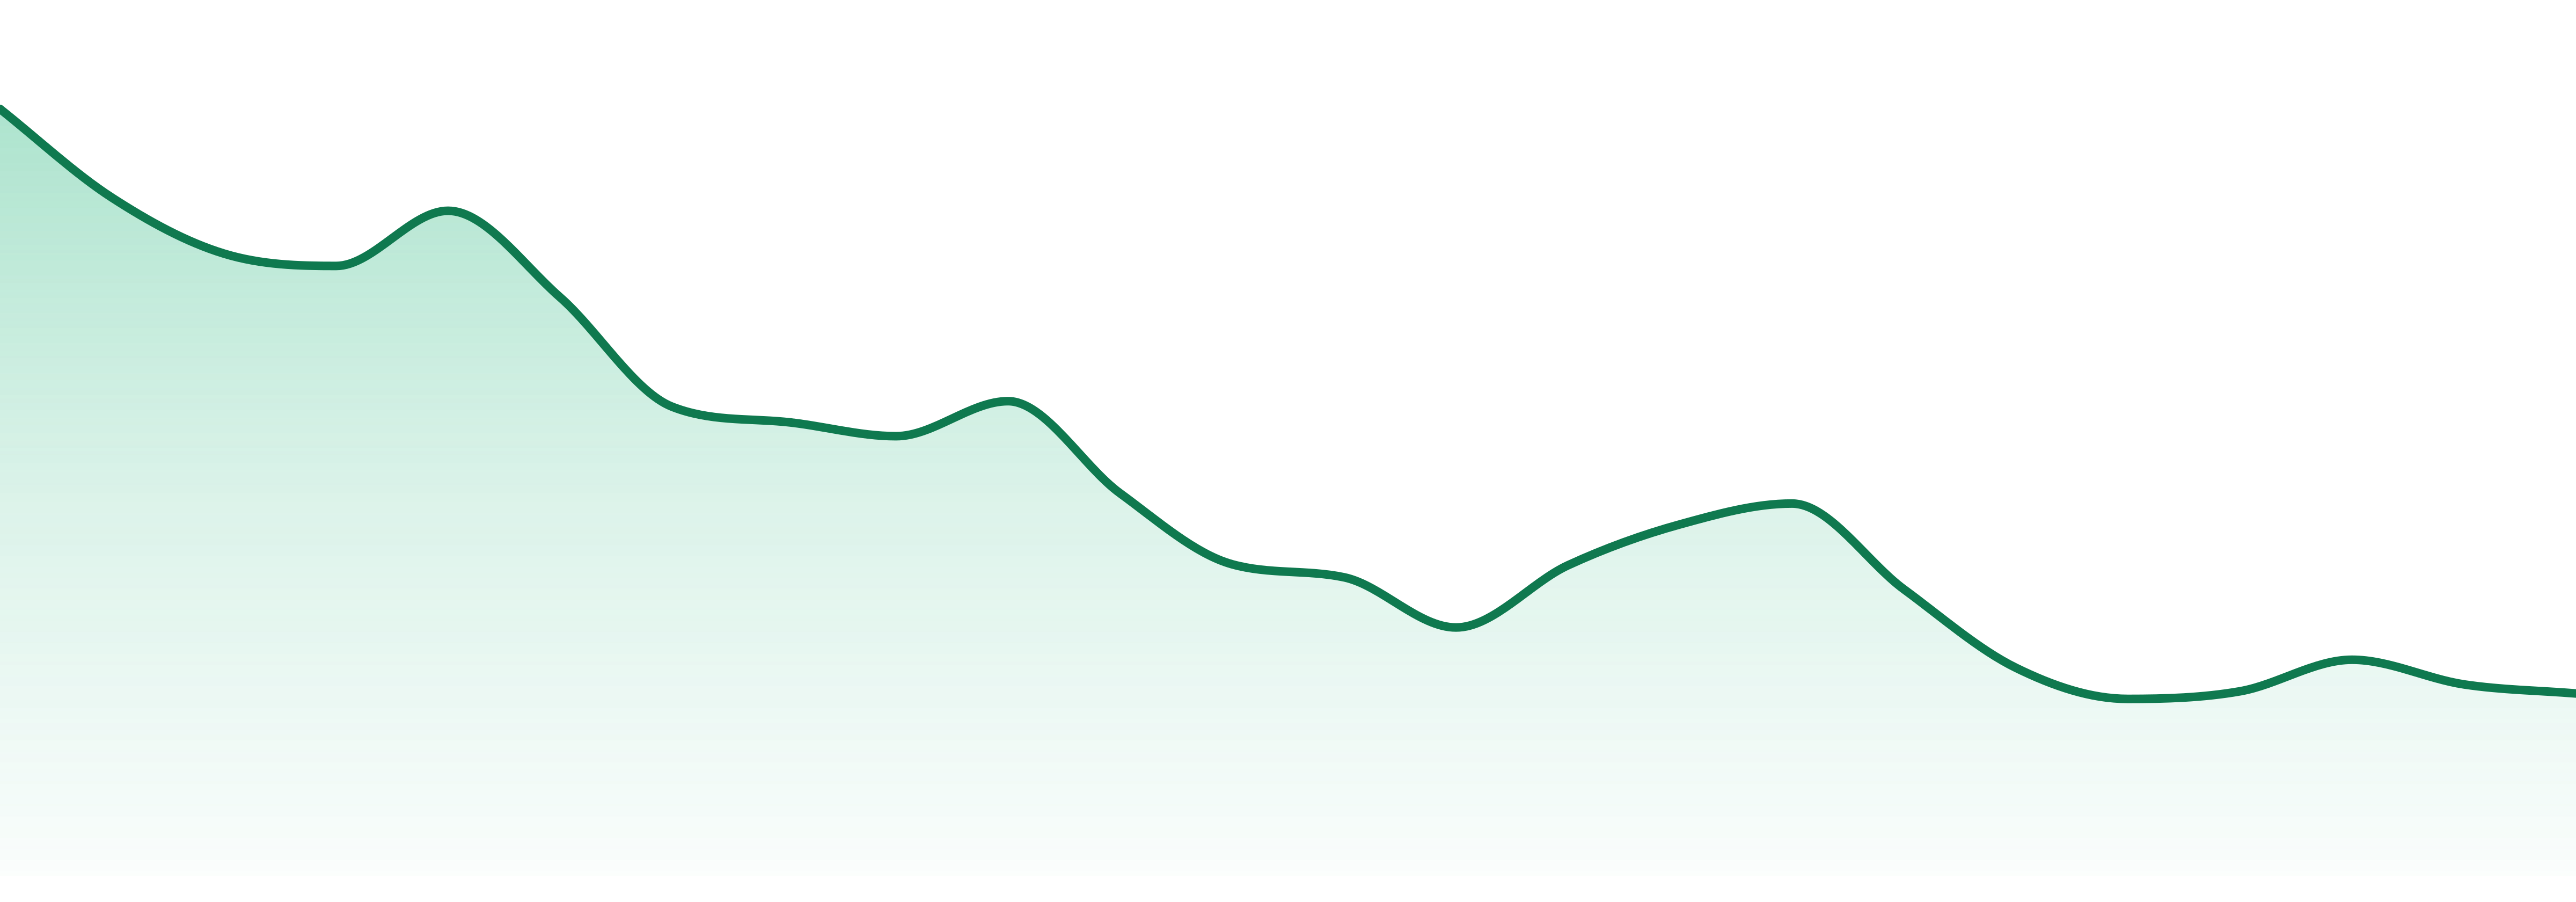
Trend View
Market Insights SnapshotFeb 2026
Trend narrative unavailable.
24-Month Trend
Average Price
$19.62
YoY Sales Trend
41.4%
2Y Sales Trend
75.8%
Edibles dominate at 65.1% of sales but are down 53.9% YoY, while Topicals show resilience with an 18.2% increase. This stark contrast highlights shifting consumer preferences.
| Category | Sales Share | Avg Price | YoY |
|---|---|---|---|
| Edibles | 65.1% | $14.97 | 53.9% |
| Topicals | 34.9% | $46.69 | 18.2% |
CANNA PUNCH is primarily concentrated in Colorado and Nevada, with a strong presence in just two states. Colorado accounts for 100% of its sales, indicating high geographic concentration.
Want SKU-Level Buyer Signals?
Unlock purchaser contacts, SKU-level velocity, and whitespace opportunities for this brand.
Market Position
Competitive LandscapeFeb 2026
Currently ranked #33 in the Edibles category, CANNA PUNCH has slipped from #27. Competing against top brands like WYLD and WANA, the brand faces increasing pressure to regain market share.
SKU View
Notable ProductsFeb 2026
Top products for Feb 2026 with sales and momentum indicators.
| Product | Category | MoM |
|---|---|---|
#1 | Topicals | 17.5% |
#2 | Topicals | 33.5% |
#3 | Edibles | 20.7% |
#4 | Topicals | 105.2% |
#5 | Edibles | 120.2% |
#6 | Topicals | 20.1% |
#7 | Topicals | 54.5% |
Benchmarking
Competitive Peer Set
Peer brands benchmarked against Canna Punch using competitive landscape rank coverage, proximity, and momentum.


