Is this your Brand? Log in to Hoodie!
Log in to HoodieLater Days
Data Snapshot for Mar 19, 2026
Overview
Every puff is packed with bold, delicious flavors that are smooth and satisfying—perfect for chilling at home or taking on the go. No hassle, just great taste in a pocket-friendly vape. Pick your favorite flavor and take it easy with Later Days.
LATER DAYS surged from #48 to #8 in just 12 months, posting +75.6% YoY growth as a mid-tier cannabis brand. Recent momentum has cooled with a -9.8% three-month decline, raising questions about whether the rapid ascent is plateauing.
Categories
- Top Category: Flower
- Price Tier: Mid-Market
- States Active: 7
Top States
Later Days Top StatesFeb 2026
Top states where Later Days is active based on indexed sales coverage.
Trend View
Market Insights SnapshotFeb 2026
Trend narrative unavailable.
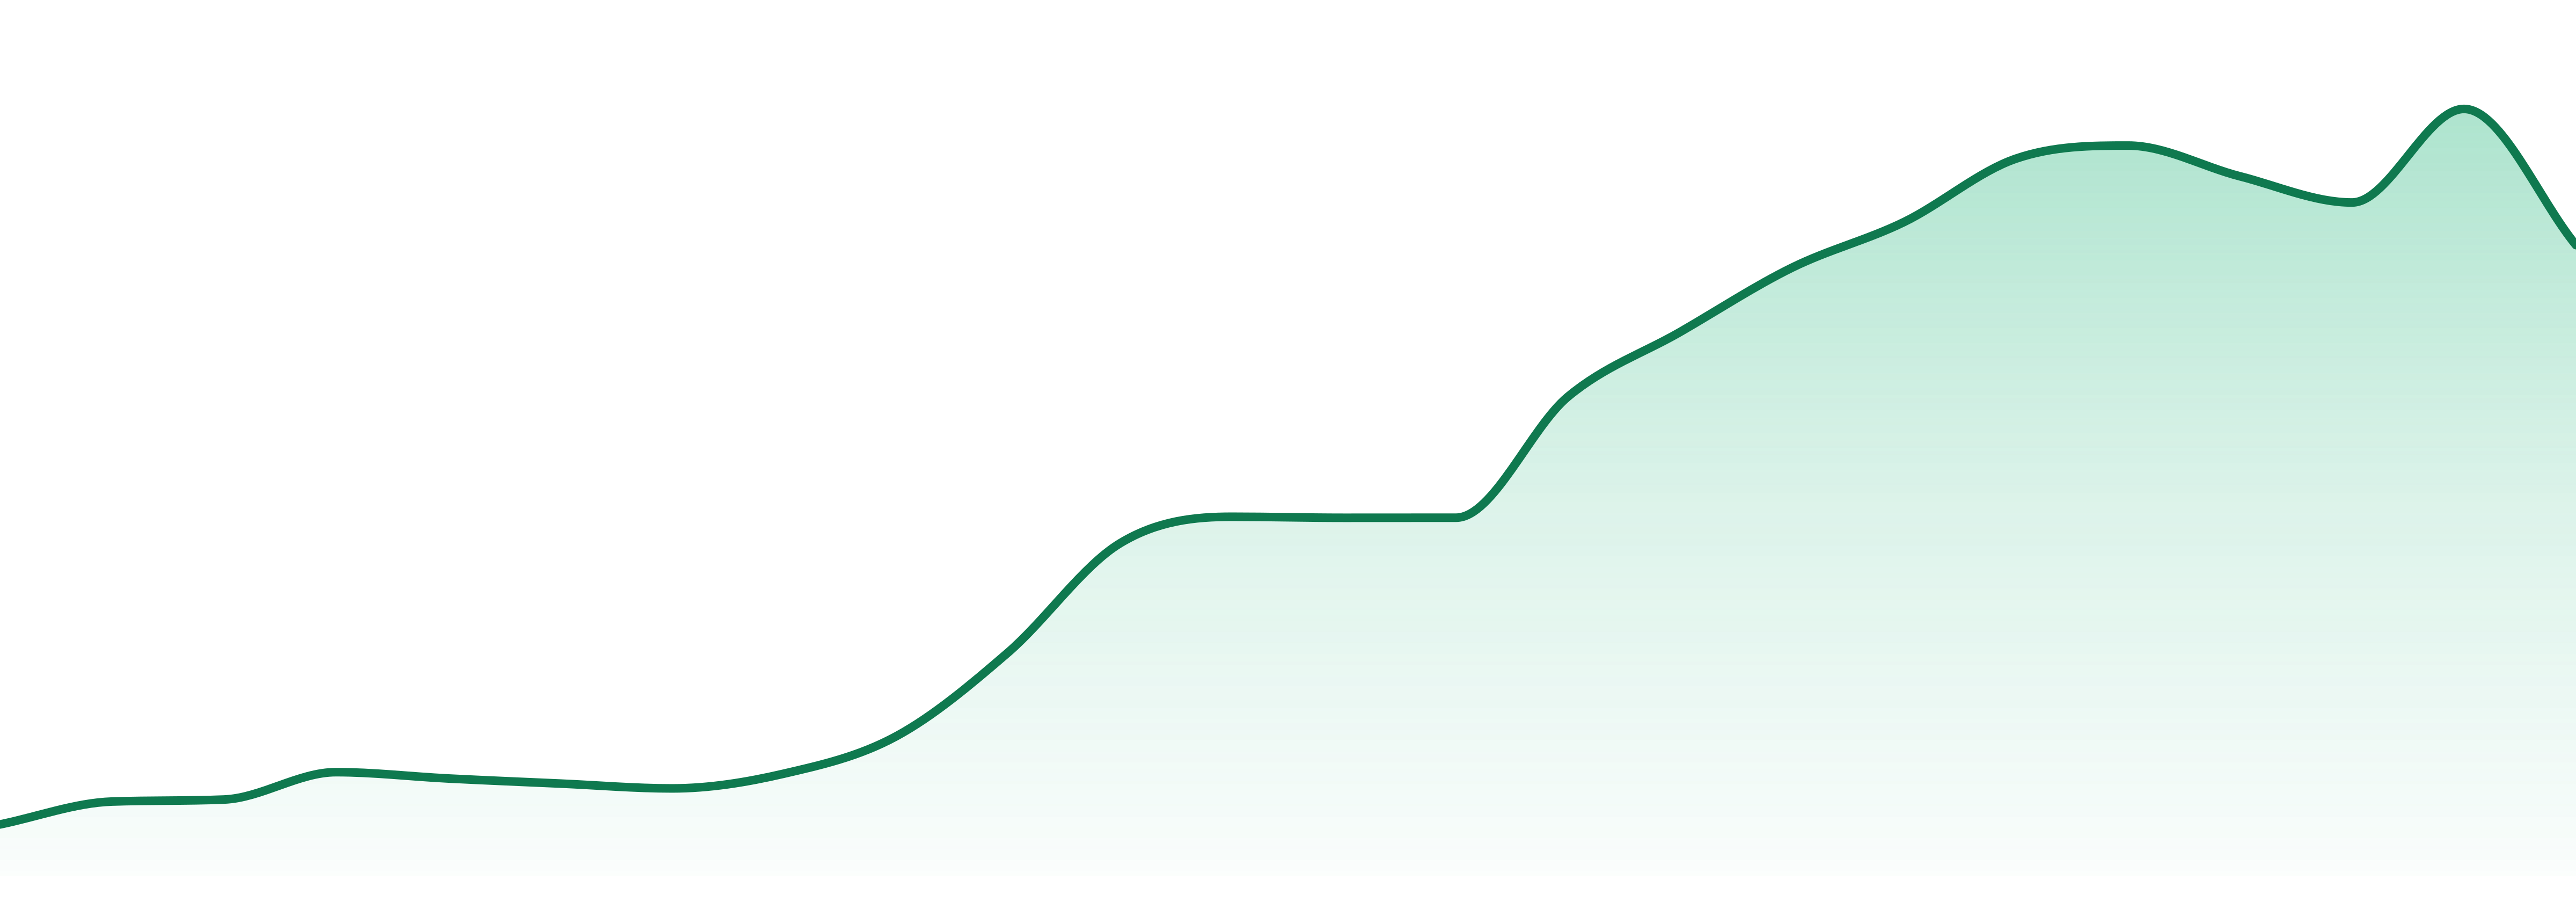
24-Month Trend
Average Price
$16.93
YoY Sales Trend
75.6%
2Y Sales Trend
886.1%
Pre-Rolls exploded +26592% YoY, transforming from near-zero to 6.7% of the mix. Flower still dominates at 70.9% with +64.2% YoY growth, while Vapes hold 22.4% at a comparable +63.2% clip. Accessories are fading at -43.6% YoY.
| Category | Sales Share | Avg Price | YoY |
|---|---|---|---|
| Flower | 70.9% | $16.86 | 64.2% |
| Vapes | 22.4% | $35.91 | 63.2% |
| Pre-Rolls | 6.7% | $6.19 | 26592.7% |
Florida commands 52.8% of sales, making LATER DAYS one of the top cannabis brands in Florida. Ohio (20.9%) and Pennsylvania (14.7%) round out the top three across a seven-state footprint that includes New Jersey and Massachusetts.
| State | Flower | Pre-Roll | Vapes |
|---|---|---|---|
| 8 | 7 | 18 | |
| 24 | 25 | 24 | |
| 18 | ⊖ | 33 | |
| 38 | ⊖ | 23 | |
| ⊖ | ⊖ | ⊖ |
Want SKU-Level Buyer Signals?
Unlock purchaser contacts, SKU-level velocity, and whitespace opportunities for this brand.
Market Position
Competitive LandscapeFeb 2026
#8 in Flower, up 40 spots from #48 a year ago, but losing ground recently to peers. MODERN FLOWER holds #1 while SUNSHINE CANNABIS leapfrogged LATER DAYS by 18 positions. SAVVY, MUV, and REEF also gained ground in recent months.
SKU View
Notable ProductsFeb 2026
Top products for Feb 2026 with sales and momentum indicators.
| Product | Category | MoM |
|---|---|---|
#1 | Flower | 0.9% |
#2 | Flower | 11.9% |
#3 | Flower | 109.3% |
#4 | Flower | 16.5% |
#5 | Flower | 7.4% |
#6 | Vapes | 112.1% |
#7 | Flower | 153.0% |
#8 | Flower | 289.2% |
#9 | Flower | 430.4% |
#10 | Flower | 330.6% |
Benchmarking
Competitive Peer Set
Peer brands benchmarked against Later Days using competitive landscape rank coverage, proximity, and momentum.


