Is this your Brand? Log in to Hoodie!
Log in to HoodieSinners Saints
Data Snapshot for Mar 19, 2026
Overview
YoY growth of 25.1% positions SINNERS SAINTS in the <250K tier. A 43.9% increase in unit volume signals heightened consumer interest, despite a 3-month sales decline of 11.1%.
Categories
- Top Category: Flower
- Price Tier: Value
- States Active: 1
Top States
Sinners Saints Top StatesFeb 2026
Top states where Sinners Saints is active based on indexed sales coverage.
Trend View
Market Insights SnapshotFeb 2026
Trend narrative unavailable.
24-Month Trend
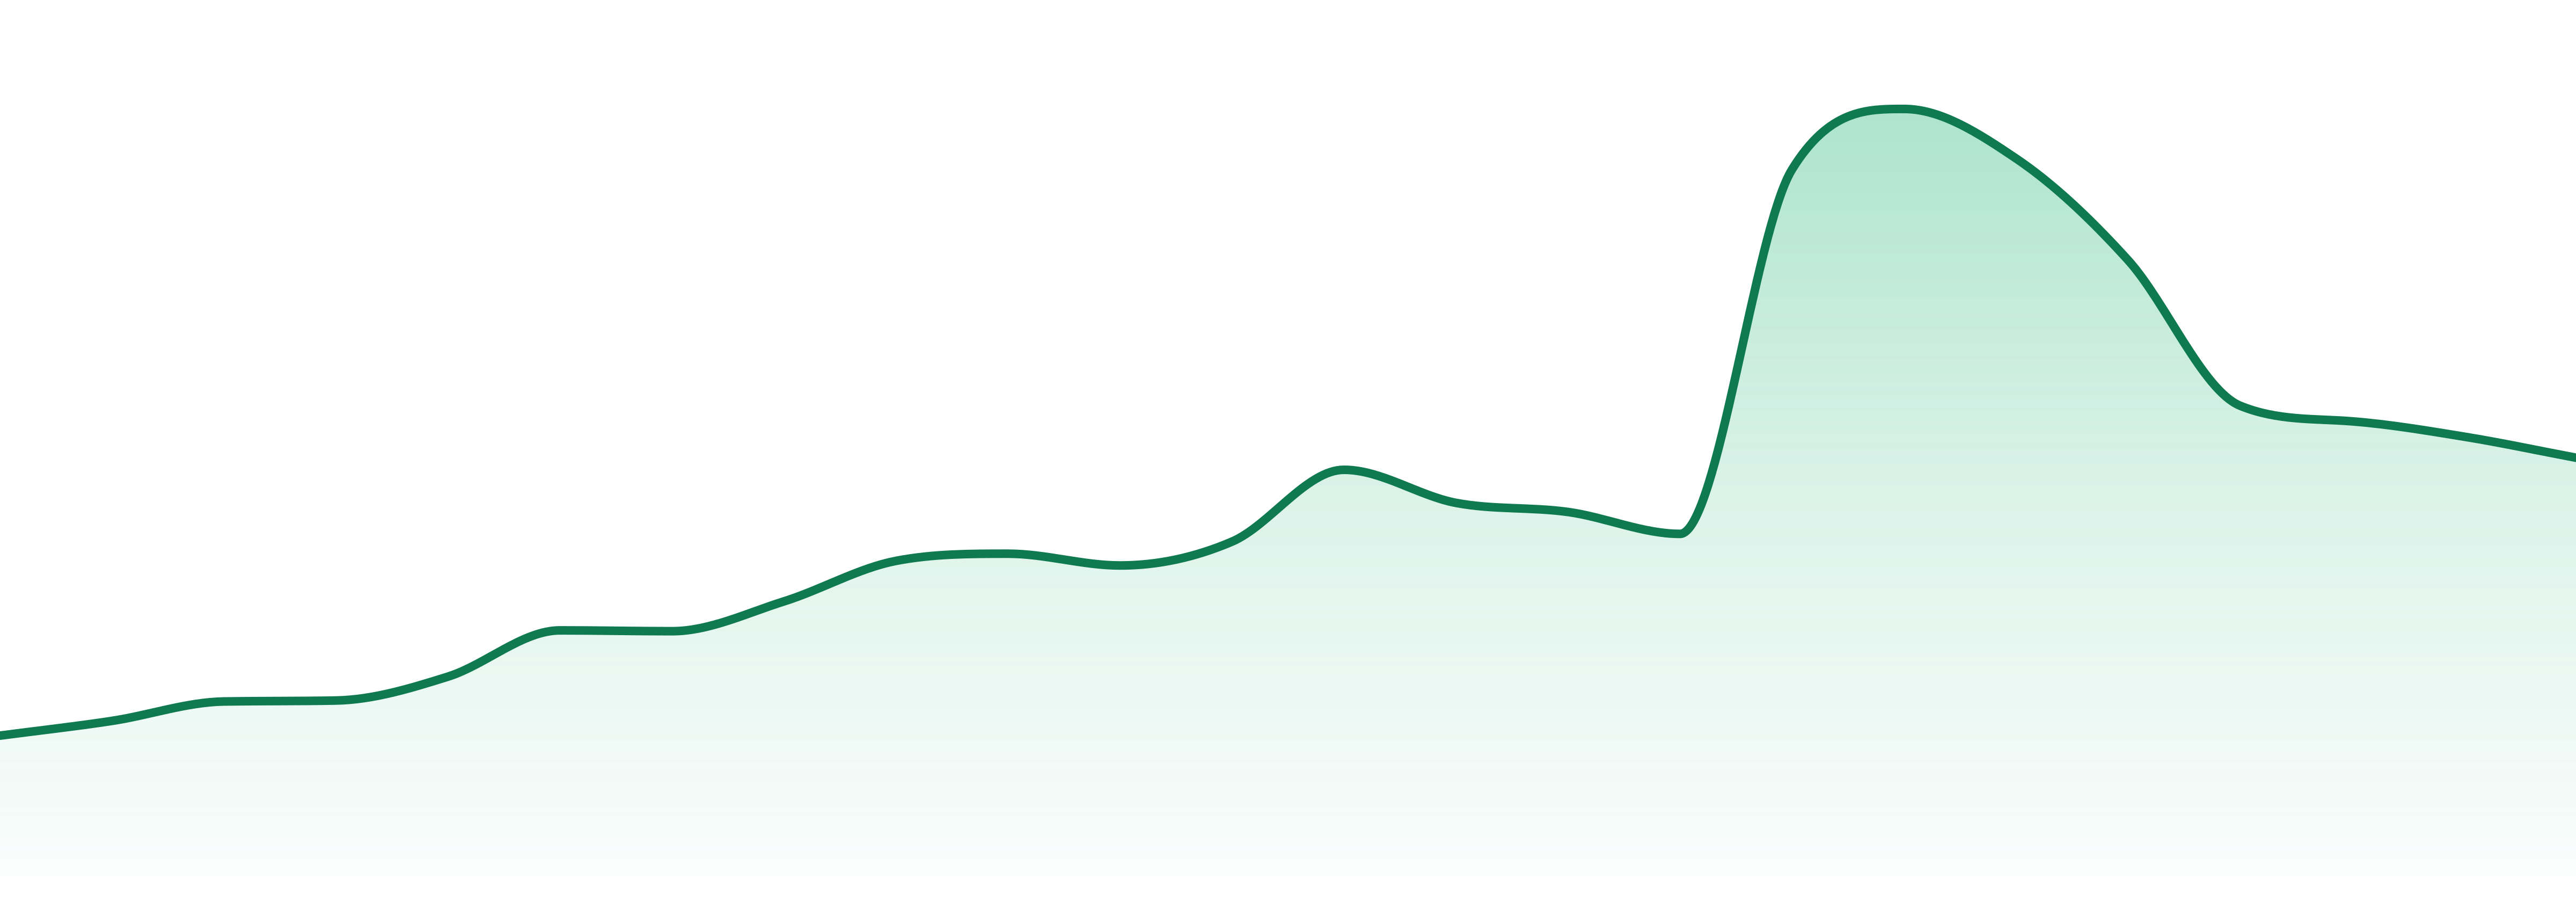
Average Price
$11.25
YoY Sales Trend
25.1%
2Y Sales Trend
238.7%
Flower dominates at 76.9% of sales, skyrocketing 37827.7% YoY, while Edibles plunge 72.3%. Other categories remain negligible, underscoring Flower's supremacy.
| Category | Sales Share | Avg Price | YoY |
|---|---|---|---|
| Flower | 76.9% | $10.65 | 37827.7% |
| Edibles | 22.1% | $13.63 | 72.3% |
SINNERS SAINTS holds a concentrated presence in Washington, accounting for 100% of sales in the state. Only active in one state.
| State | Edibles | Flower |
|---|---|---|
| 39 | 27 |
Want SKU-Level Buyer Signals?
Unlock purchaser contacts, SKU-level velocity, and whitespace opportunities for this brand.
Market Position
Competitive LandscapeFeb 2026
Ranked #27 overall, SINNERS SAINTS is 26 spots behind leader PHAT PANDA in the Flower category. The brand improved its rank from #272 to #27 in just one year.
SKU View
Notable ProductsFeb 2026
Top products for Feb 2026 with sales and momentum indicators.
| Product | Category | MoM |
|---|---|---|
#1 | Flower | 6.5% |
#2 | Flower | 6.5% |
#3 | Flower | 6.5% |
#4 | Edibles | 5.2% |
#5 | Edibles | 2.6% |
#6 | Edibles | 0.5% |
#7 | Edibles | 19.5% |
#8 | Edibles | 3.6% |
#9 | Edibles | 8.2% |
#10 | Edibles | 4.5% |
Benchmarking
Competitive Peer Set
Peer brands benchmarked against Sinners Saints using competitive landscape rank coverage, proximity, and momentum.


