Is this your Brand? Log in to Hoodie!
Log in to HoodieGood Feels
Data Snapshot for Mar 19, 2026
Overview
Where food and drink are a labor of love, Good Feels’ seltzers and mix ins more than just great recipes. Happy people make better beverages. Better beverages make people happy. We know you’ll feel the difference.
GOOD FEELS plummeted 24.5% YoY, signaling a significant struggle in the premium tier. Sales have declined 7.4% over the past three months, with a 17.7% drop in monthly trends from December to February. The brand faces mounting challenges in maintaining its market position.
Categories
- Top Category: Edibles
- Price Tier: Premium
- States Active: 1
Top States
Good Feels Top StatesFeb 2026
Top states where Good Feels is active based on indexed sales coverage.
Trend View
Market Insights SnapshotFeb 2026
Trend narrative unavailable.
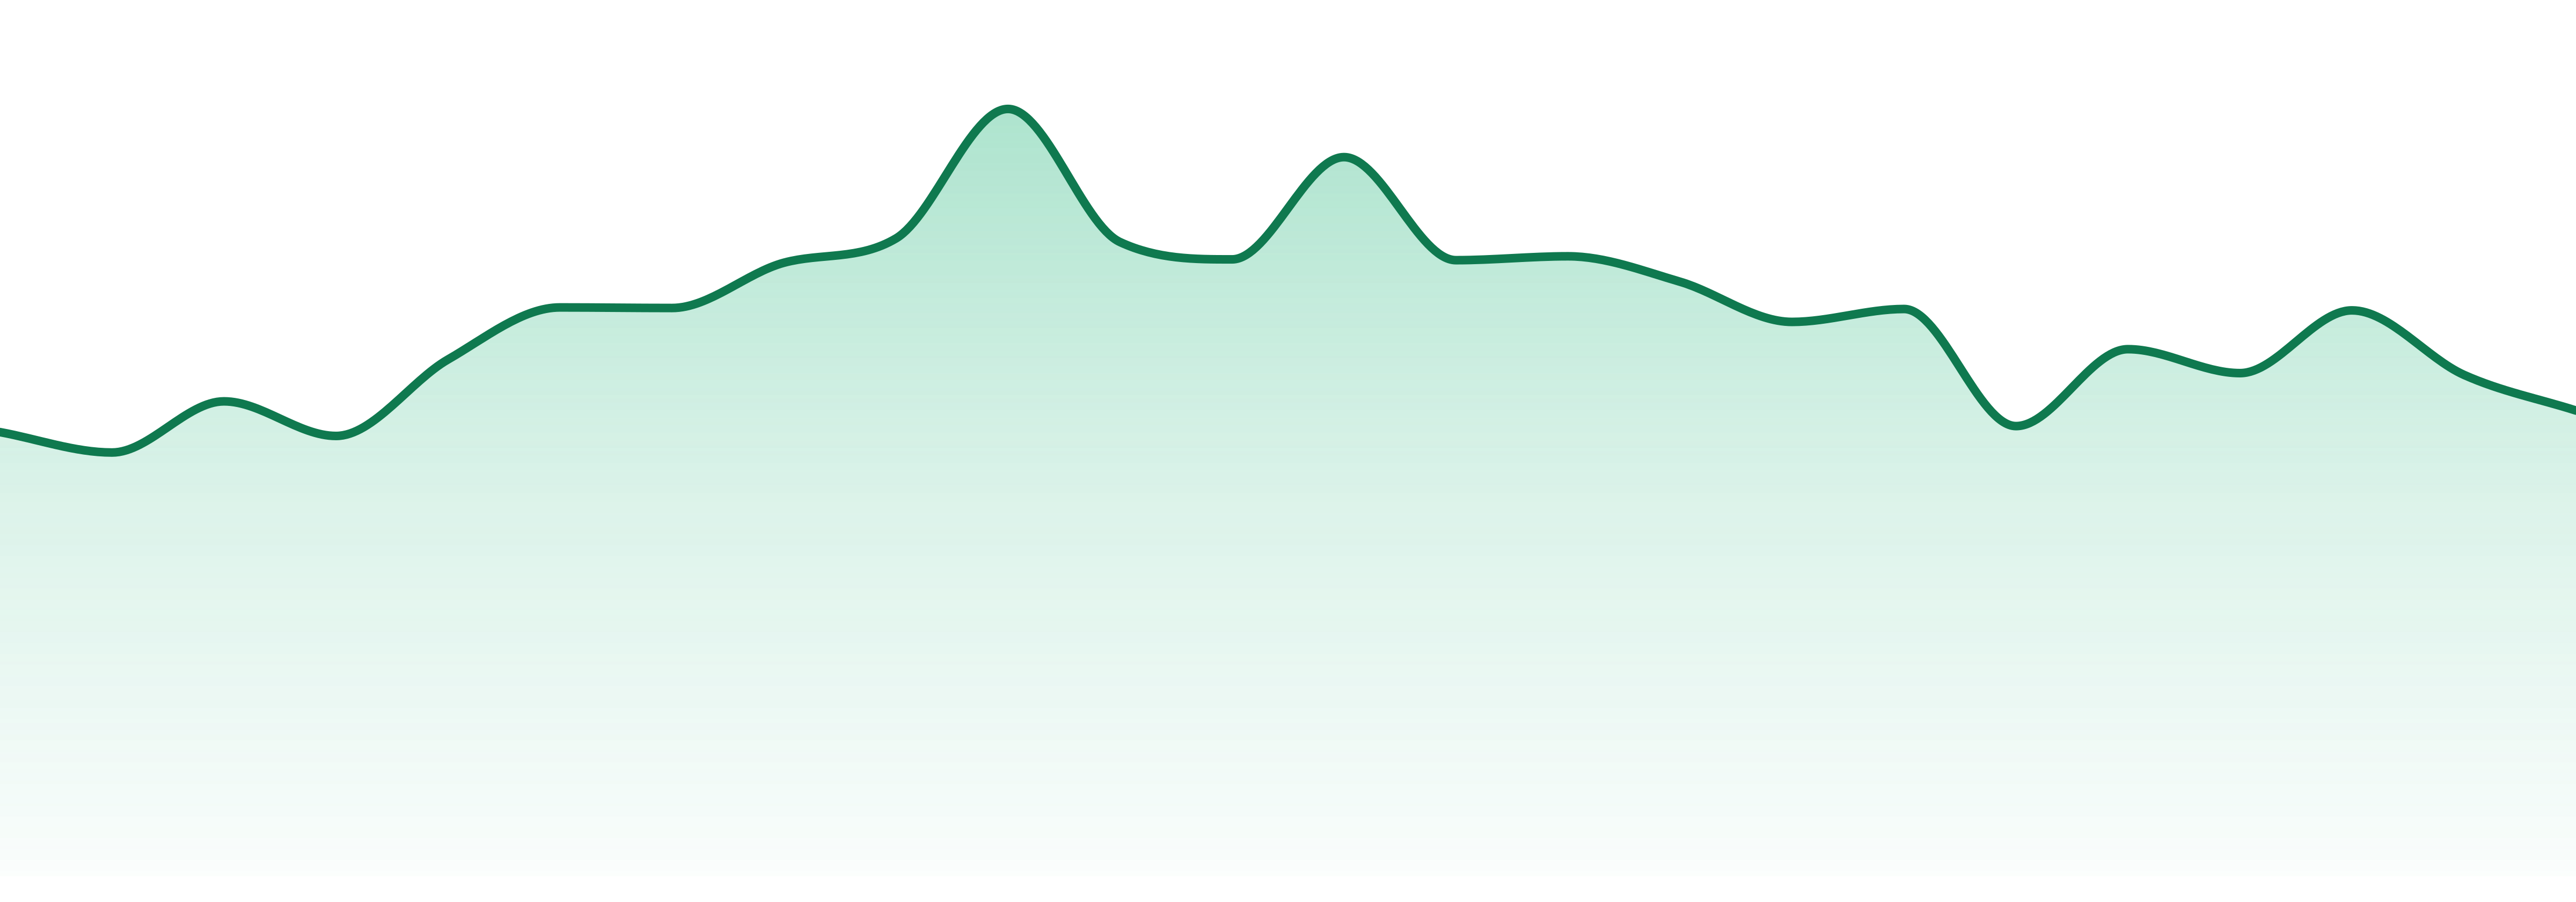
24-Month Trend
Average Price
$36.77
YoY Sales Trend
24.5%
2Y Sales Trend
15.3%
Edibles dominate, making up 78.8% of total sales but down 27.4% YoY. Oral products contribute 20.5%, decreasing 10.3% YoY, while Concentrates are barely noticeable at 0.6% and down 36.2% YoY. The concentration in Edibles is striking.
| Category | Sales Share | Avg Price | YoY |
|---|---|---|---|
| Edibles | 78.8% | $36.58 | 27.4% |
| Oral | 20.5% | $36.99 | 10.3% |
GOOD FEELS is concentrated solely in Massachusetts, capturing 100% of its sales in this state. The brand's geographic presence is limited, making it vulnerable to market fluctuations and competition.
| State | Edibles | Oral |
|---|---|---|
| 30 | 7 |
Want SKU-Level Buyer Signals?
Unlock purchaser contacts, SKU-level velocity, and whitespace opportunities for this brand.
Market Position
Competitive LandscapeFeb 2026
GOOD FEELS ranks #30 in the Edibles category, slipping from #21 over the past year. Competing brands like BETTY'S EDDIES and WYLD dominate, with GOOD FEELS trailing 29 ranks behind the leader. The competitive landscape is tightening.
SKU View
Notable ProductsFeb 2026
Top products for Feb 2026 with sales and momentum indicators.
| Product | Category | MoM |
|---|---|---|
#1 | Edibles | 16.5% |
#2 | Edibles | 28.8% |
#3 | Edibles | 11.7% |
#4 | Edibles | 1.8% |
#5 | Edibles | 26.1% |
#6 | Oral | 8.5% |
#7 | Oral | 35.8% |
#8 | Edibles | 67.9% |
#9 | Oral | 15.8% |
#10 | Oral | 91.9% |
Benchmarking
Competitive Peer Set
Peer brands benchmarked against Good Feels using competitive landscape rank coverage, proximity, and momentum.


