Is this your Brand? Log in to Hoodie!
Log in to HoodieFused
Data Snapshot for Mar 19, 2026
Overview
FUSED has surged with YoY growth at +71.1%—a mid-tier brand on the rise. Recent 3-month sales trend shows an increase of +38.0%, indicating strong momentum in a competitive landscape.
Categories
- Top Category: Pre-Rolls
- Price Tier: Mid-Market
- States Active: 3
Top States
Fused Top StatesFeb 2026
Top states where Fused is active based on indexed sales coverage.
Trend View
Market Insights SnapshotFeb 2026
Trend narrative unavailable.
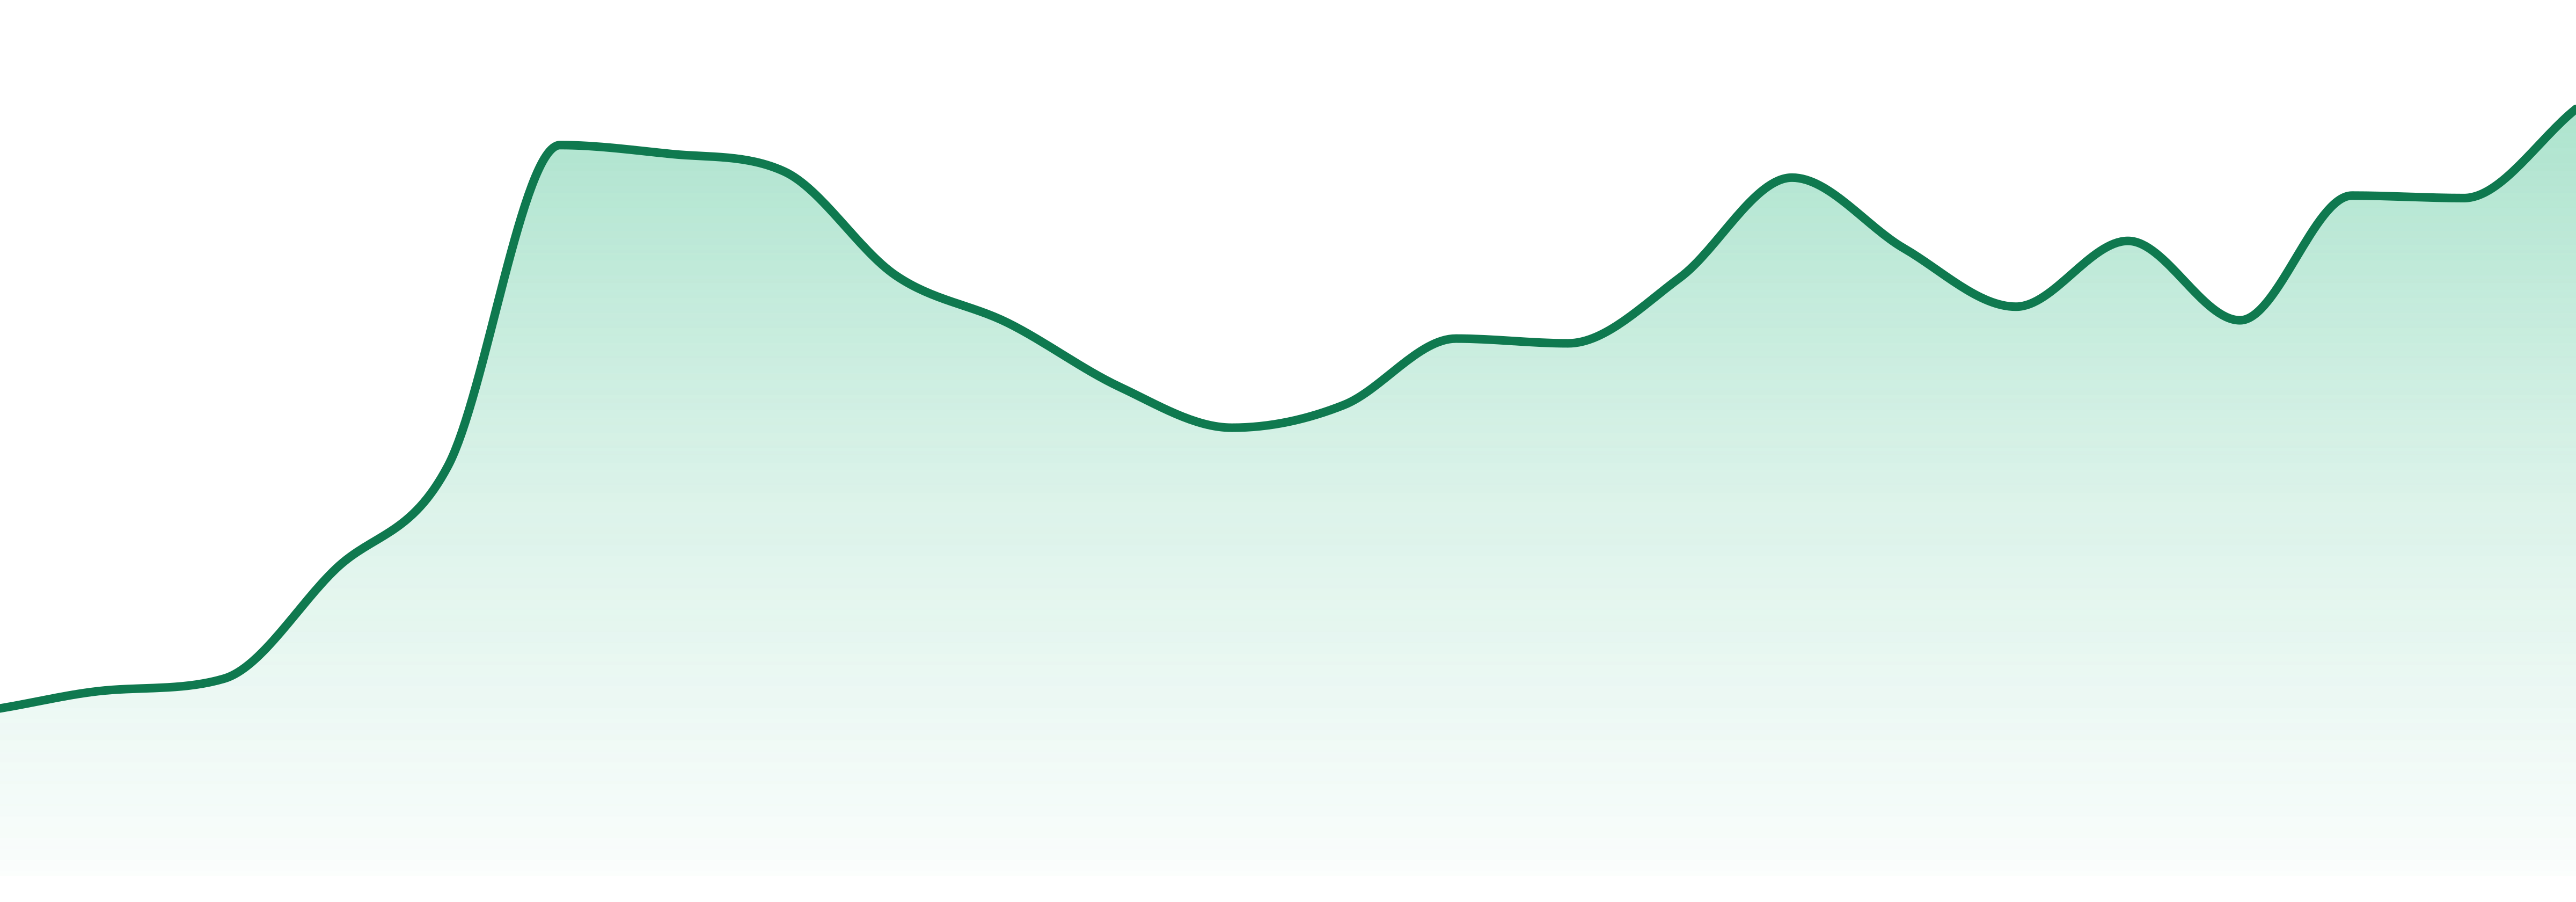
24-Month Trend
Average Price
$20.45
YoY Sales Trend
71.1%
2Y Sales Trend
382.4%
Pre-Rolls dominate at 82.2% of total sales, experiencing impressive growth at +78.7% YoY. Edibles follow with a notable +61.2%, while Concentrates grow at +18.9%.
| Category | Sales Share | Avg Price | YoY |
|---|---|---|---|
| Pre-Rolls | 82.2% | $23.38 | 78.7% |
| Edibles | 10.8% | $9.52 | 61.2% |
| Concentrates | 6.8% | $29.73 | 18.9% |
FUSED is primarily concentrated in Montana, which leads at 95.5% of sales. Massachusetts and California follow, showing high geographic concentration across just three states.
| State | Concentrates | Edibles | Pre-Roll |
|---|---|---|---|
| 29 | 19 | 5 | |
| ⊖ | ⊖ | ⊖ |
Want SKU-Level Buyer Signals?
Unlock purchaser contacts, SKU-level velocity, and whitespace opportunities for this brand.
Market Position
Competitive LandscapeFeb 2026
Competitive summary unavailable.
SKU View
Notable ProductsFeb 2026
Top products for Feb 2026 with sales and momentum indicators.
| Product | Category | MoM |
|---|---|---|
#1 | Pre-Rolls | 23.8% |
#2 | Pre-Rolls | 11.0% |
#3 | Pre-Rolls | 17.2% |
#4 | Pre-Rolls | 31.1% |
#5 | Pre-Rolls | 22.7% |
#6 | Pre-Rolls | 14.8% |
#7 | Pre-Rolls | 64.4% |
#8 | Pre-Rolls | 133.7% |
Benchmarking
Competitive Peer Set
Peer brands benchmarked against Fused using competitive landscape rank coverage, proximity, and momentum.


