Is this your Brand? Log in to Hoodie!
Log in to HoodieFruit Stand
Data Snapshot for Mar 19, 2026
Overview
YoY sales plummeted 23.1% for FRUIT STAND, yet it improved its rank from #30 to #20. A 18.5% drop over the last three months indicates ongoing challenges, but strategic adjustments could be in play to retain market presence.
Categories
- Top Category: Pre-Rolls
- Price Tier: Mid-Market
- States Active: 5
Top States
Fruit Stand Top StatesFeb 2026
Top states where Fruit Stand is active based on indexed sales coverage.
Trend View
Market Insights SnapshotFeb 2026
Trend narrative unavailable.
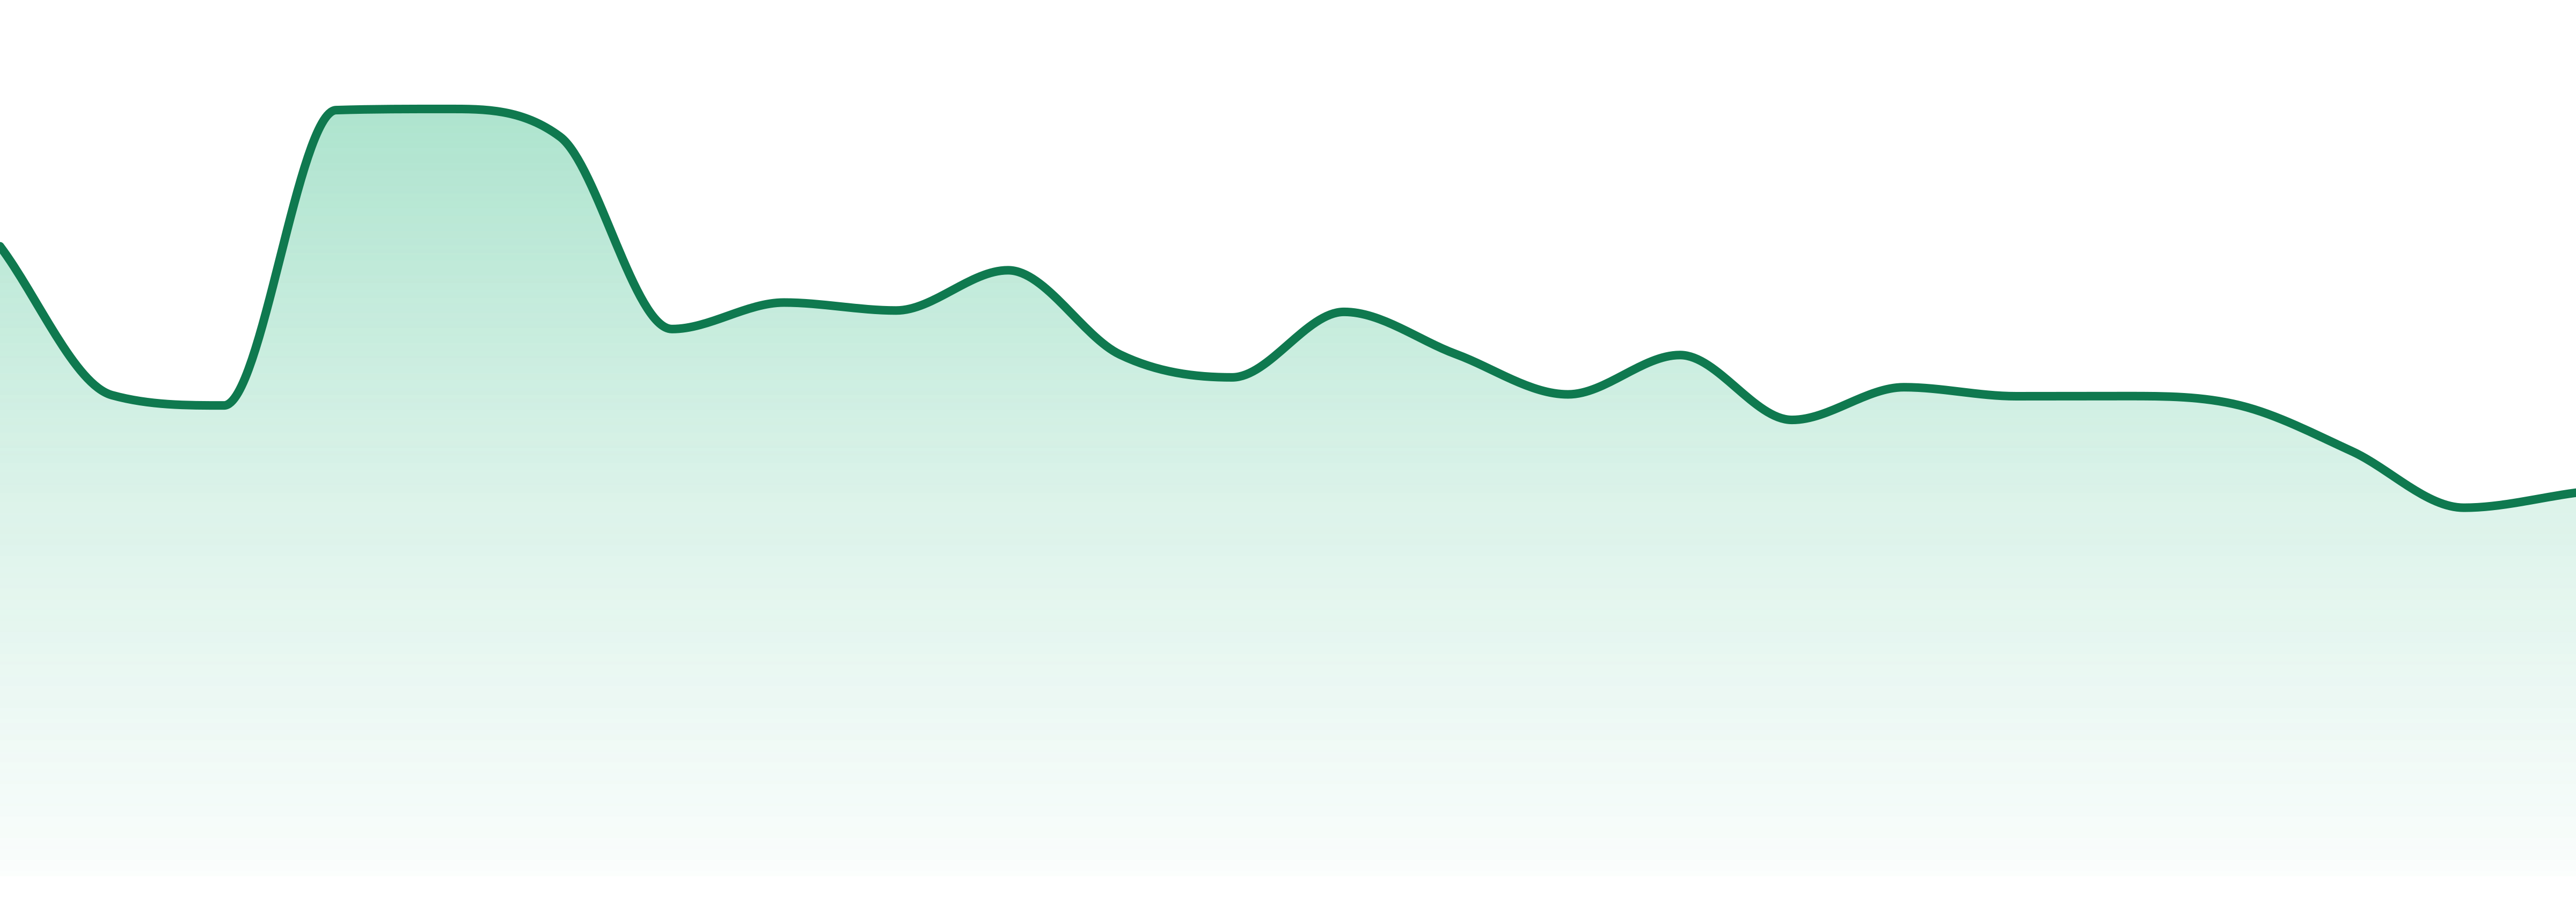
24-Month Trend
Average Price
$12.2
YoY Sales Trend
23.1%
2Y Sales Trend
11.2%
Pre-Rolls dominate at 49.0% with a remarkable 116.1% YoY surge; however, Vapes are struggling at -57.4% YoY. Edibles and Flower show mixed results with -23.0% and +10.7% YoY respectively, reflecting varied consumer preferences.
| Category | Sales Share | Avg Price | YoY |
|---|---|---|---|
| Pre-Rolls | 49.0% | $8.92 | 116.1% |
| Vapes | 39.9% | $23.89 | 57.4% |
| Edibles | 9.7% | $10.81 | 23.0% |
FRUIT STAND excels in Oklahoma (49.7%) and Illinois (36.0%), with a notable presence in Massachusetts (13.4%). Its reach spans five states, emphasizing a concentration in key markets.
| State | Edibles | Pre-Roll | Vapes |
|---|---|---|---|
| ⊖ | 20 | ⊖ | |
| ⊖ | ⊖ | ⊖ | |
| ⊖ | ⊖ | ⊖ | |
| ⊖ | ⊖ | ⊖ |
Want SKU-Level Buyer Signals?
Unlock purchaser contacts, SKU-level velocity, and whitespace opportunities for this brand.
Market Position
Competitive LandscapeFeb 2026
Competitive summary unavailable.
SKU View
Notable ProductsFeb 2026
Top products for Feb 2026 with sales and momentum indicators.
| Product | Category | MoM |
|---|---|---|
#1 | Pre-Rolls | 0.3% |
#2 | Vapes | 25.9% |
#3 | Vapes | 56.6% |
#4 | Vapes | 37.0% |
#5 | Vapes | 37.3% |
#6 | Edibles | 41.2% |
#7 | Edibles | 51.3% |
#8 | Flower | 37.3% |
Benchmarking
Competitive Peer Set
Peer brands benchmarked against Fruit Stand using competitive landscape rank coverage, proximity, and momentum.


